The Vancouver real estate market has been walloped in recent months – a combination of the federal mortgage stress test, foreign buyers’ and speculation taxes, and price fatigue have led to a deep decline in sales, the effect of which is starting to filter down into benchmark home prices.
The latest report from the Real Estate Board of Greater Vancouver reveals January sales activity plunged 39.3% from the same month last year, with 1,103 homes trading hands, while a 27% uptick in MLS listings in Vancouver is flooding the market with supply.
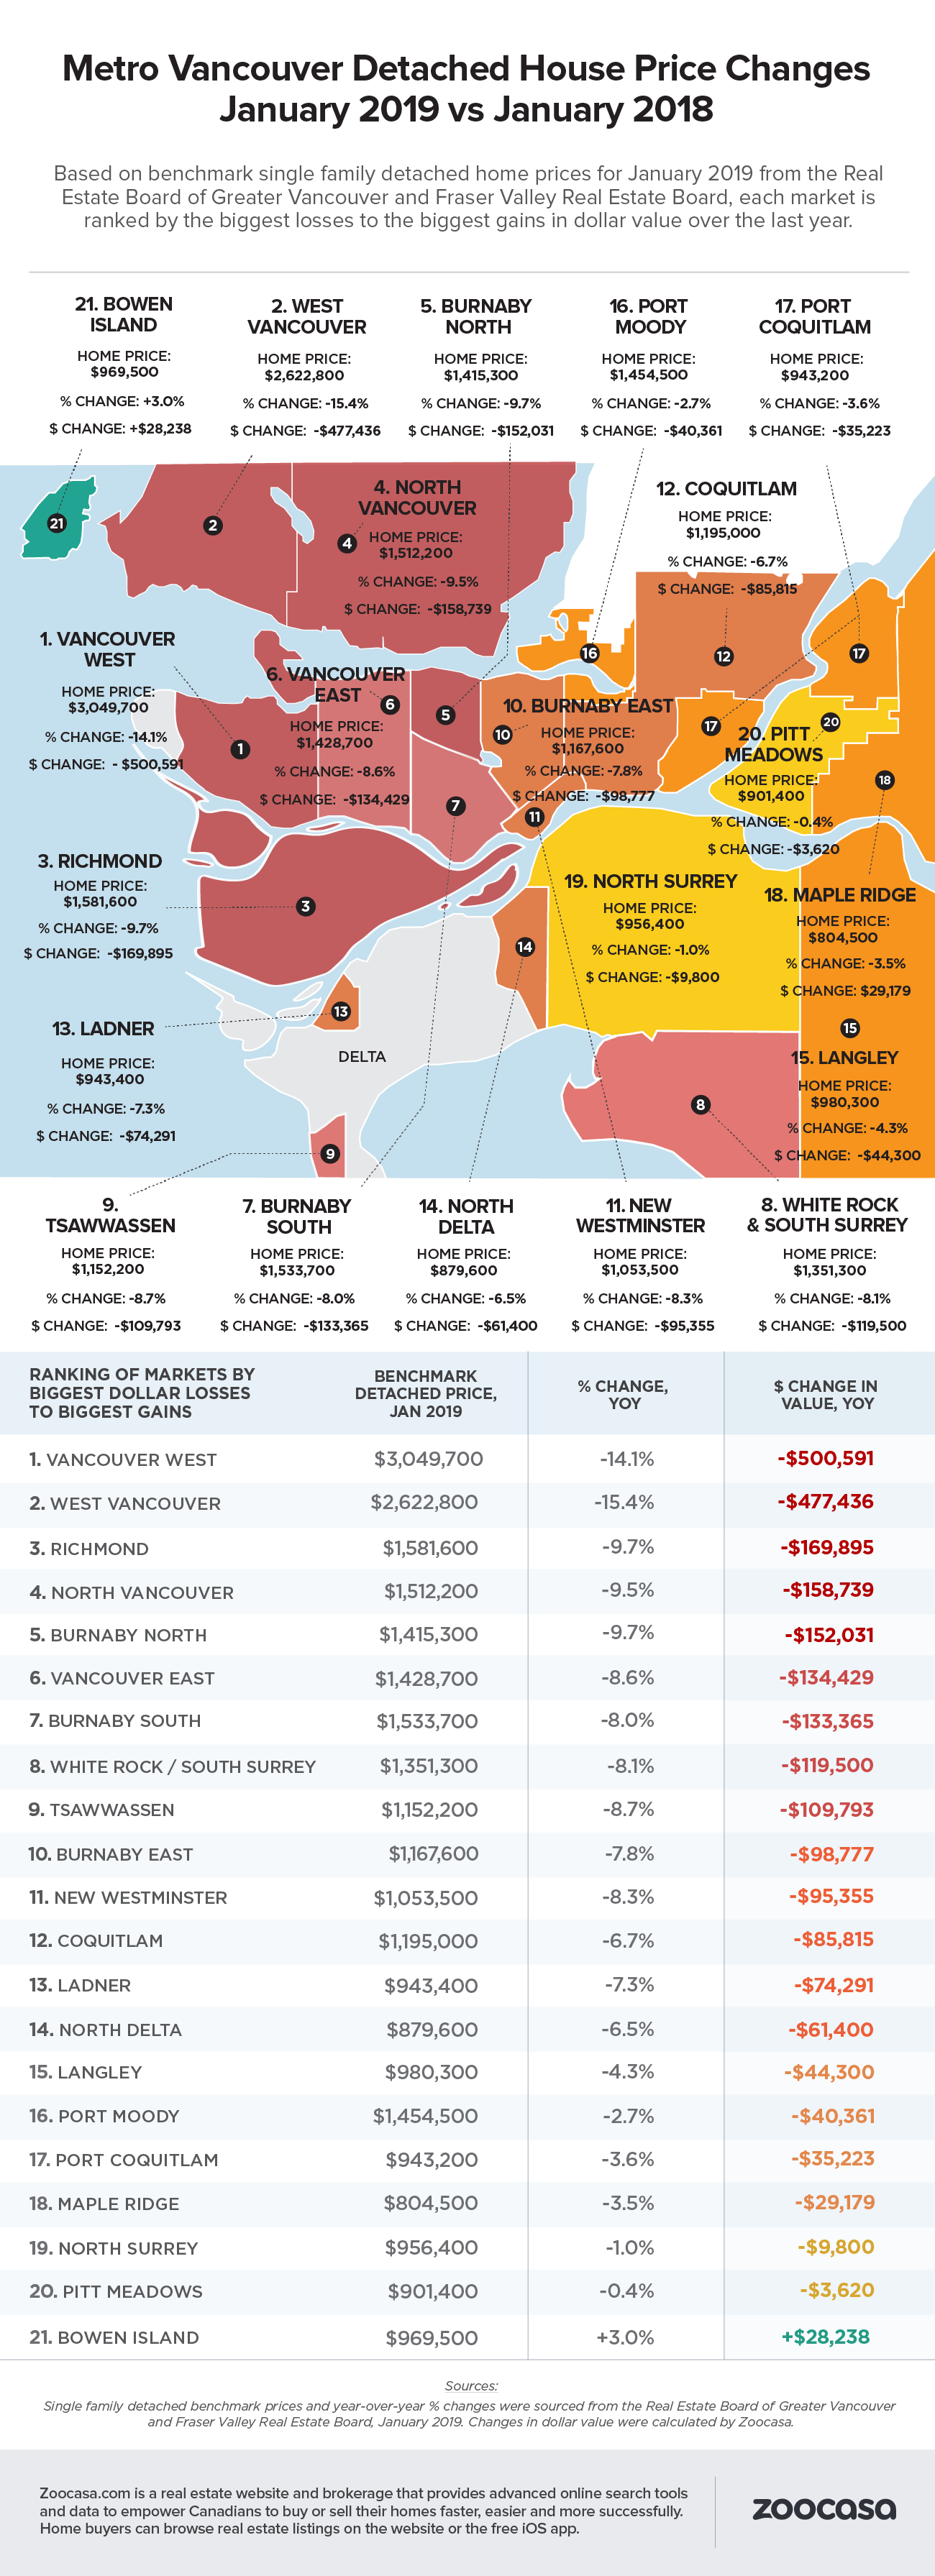
House Prices Plunge in 21 Vancouver Neighbourhoods
That’s put dramatic downward pressure on prices; according to recent calculations conducted by Zoocasa, average home values have fallen in the majority of markets across Greater Vancouver.
The study compared the year-over-year difference in January benchmark home prices across 21 areas in the region for single-family detached homes and apartments, and revealed dollar losses of hundreds of thousands of dollars in the highest-priced housing markets.
All but one of the studied detached markets saw deprecation. The hardest hit was Vancouver West, which saw average prices dip 14.1% from last year to an average of $3,049,700 – a loss of $500,591. That’s followed by West Vancouver where prices fell 15.4% to an average of $2,622,800, representing a decline of $477,436.
The areas of Richmond, North Vancouver, and Burnaby North also saw detached home values dip nearly 10%, representing dollar losses between $150,000 and $170,000.
It was a more positive year, however, for owners of detached properties off the mainland – Bowen Island was the only market that saw appreciation, up 3% year over year to an average of $969,500, an equity increase of $28,238.
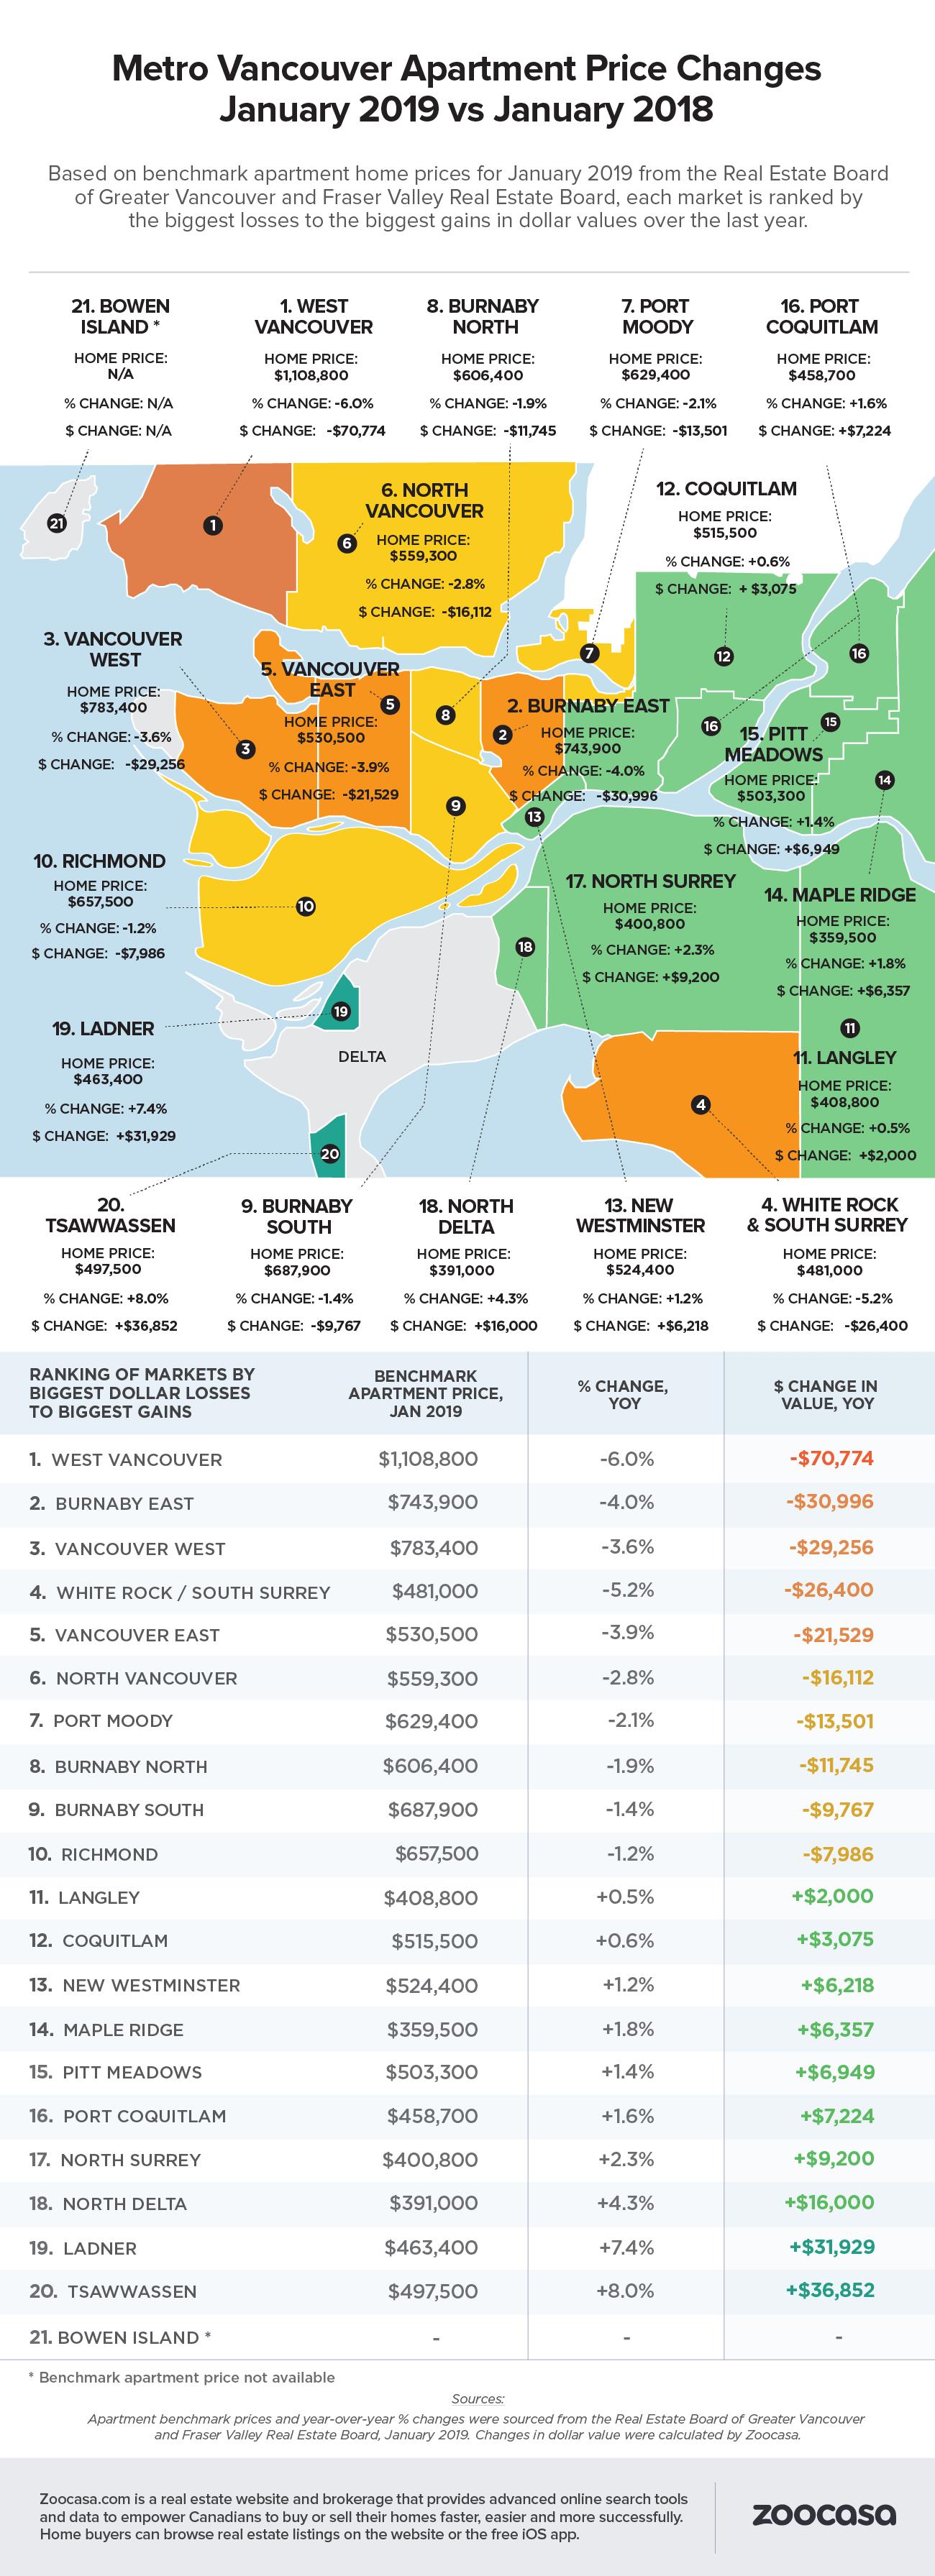
Year-over-Year Condo Prices More Resilient
The data also supports the fact that homes at the most affordable price points continue to drive market growth – prices for Vancouver condos for sale appreciated in 10 of the 21 markets with the greatest increase in Tsawwassen, which rose $36,852 to an average of $497,500 (+8%). Ladner saw the second-greatest increase, up $31,929 to $463,400 (+7.4%), followed by North Delta, up $16,000 to $391,000 (+4.3%).
Again, it was luxury units that experienced the greatest decline in value, falling an average of $70,774 in West Vancouver to $1,108,800 (-6%), $30,996 to $743,900 in Burnaby East (-4%), and down $29,256 in Vancouver West to $783,400 (-3.6%).
Top 5 Vancouver Markets for House Price Depreciation
1 – Vancouver West
January 2019 Average Price: $3,049,700
% Change: -14.1%
Depreciation: -$500,591
2 – West Vancouver
January 2019 Average Price: $2,622,800
% Change: -15.4%
Depreciation: -$477,436
3 – Richmond
January 2019 Average Price: $1,581,600
% Change: -9.7%
Depreciation: -$169,895
4 – North Vancouver
January 2019 Average Price: $1,512,200
% Change: -9.5%
Depreciation: -$158,739
5 – Burnaby North
January 2019 Average Price: $1,415,300
% Change: -9.7%
Depreciation: -$152,031
Top 5 Vancouver Markets for Condo Price Depreciation
1 – West Vancouver
January 2019 Average Price: $1,108,800
% Change: -6%
Depreciation: -$70,744
2 – Burnaby East
January 2019 Average Price: $743,900
% Change: -4%
Depreciation: -$30,996
3 – Burnaby East
January 2019 Average Price: $783,400
% Change: -3.6%
Depreciation: -$29,256
4 – White Rock / South Surrey
January 2019 Average Price: $481,000
% Change: -5.2%
Depreciation: -$26,400
5 – Vancouver East
January 2019 Average Price: $530,500
% Change: -3.9%
Depreciation: -$21,529
Methodology
Apartment benchmark prices and year-over-year % changes were sourced from the Real Estate Board of Greater Vancouver and Fraser Valley Real Estate Board, January 2019. Changes in dollar value were calculated by Zoocasa.
Single family detached benchmark prices and year-over-year % changes were sourced from the Real Estate Board of Greater Vancouver and Fraser Valley Real Estate Board, January 2019. Changes in dollar value were calculated by Zoocasa.
About Zoocasa
Zoocasa.com is a real estate website and brokerage that provides advanced online search tools and data to empower Canadians to buy or sell their homes faster, easier and more successfully. Home buyers can browse real estate listings on the website or the free real estate iOS app.
For more information about this report or to set up a media interview, please email communications@zoocasa.com.