Warm weather coupled with easing COVID-19 restrictions led to a housing resurgence in the GTA over the summer following a spring market lull. Further, shifting housing priorities as a result of the pandemic resulted in a staggering increase in the supply of available condo rentals in the City of Toronto, leaving renters and prospective buyers contemplating their next move. Those interested in living in a condo apartment and considering a move to or within the City of Toronto may be wondering: is it better to buy or rent?
Using quarterly data from the Toronto Regional Real Estate Board (TRREB), Zoocasa compared the price-to-rent ratio (PTRR) for 35 neighbourhoods across the City of Toronto to highlight neighbourhoods where it may be better to rent a condo apartment, and where it may be better to buy. Our data offers a high-level comparison of pricing trends for rental and sale properties across the City of Toronto in the second quarter of 2020. Prospective buyers and renters should consider a detailed pricing analysis for properties that match their needs in the neighbourhoods they desire to guide their individual decisions.
Price-to-Rent Ratio Helps Prospective Buyers and Renters Compare Neighbourhoods
The price-to-rent ratio is a useful measure for renters and prospective buyers to compare the economics of buying versus renting. While the PTRR does not account for affordability factors like the carrying costs of home ownership (e.g. mortgage payments, property taxes, or condo maintenance fees) and the income required to qualify for a mortgage, the PTRR is a helpful metric for comparing home prices to rental rates across different neighbourhoods.
The PTRR is calculated as the purchase price divided by the annual rent rate and measures how many years of rent the purchase cost is equal to. Specifically:
Price-to-Rent Ratio (PTRR) = Purchase Price / Annual Rent Rate (i.e. Monthly Rent Rate x 12 months)
Generally speaking, a lower ratio between 1 and 15 suggests that buying offers better value than renting, while a ratio of 21 or more suggests it is better to rent than to buy.
Average City of Toronto Condo Price is Equal to 22 Years Worth of Rent
Our findings reveal that across the City of Toronto, the average condo apartment purchase price from Q2 2020 was equal to about two decades worth of rent. With the average condo price of $661,458 and the average monthly lease rate of $2,501, the price-to-rent ratio in the City of Toronto was 22, meaning that the average condo price is 22 years’ worth of today’s average rental rates.
Of the 35 neighbourhoods included in our analysis, 22 had a PTRR of at least 21 years, indicating that overall, renting a condo apartment may currently offer more value than purchasing one in the majority of Toronto neighbourhoods. Only two neighbourhoods had a PTRR of 15 or under.
Renting A Condo Apartment in Central Toronto Neighbourhoods May Offer Better Value Than Buying
The average condo purchase in central Toronto neighbourhoods, which include downtown Toronto, midtown, and North York, was equivalent to at least 21 years of today’s average annual rental rates. This signals that someone deciding between buying or renting in these areas may find better value if they opt to rent.
4 of the 5 Toronto neighbourhoods with the steepest price-to-rent ratios were in central Toronto. These include C08 (Regent Park, St. James Town, Corktown), C02 (Yorkville, Annex, Summerhill) and C12 (York Mills, Bridle Path, and Hoggs Hollow). C09 (Rosedale, Moore Park) took the top spot with a price-to-rent ratio of 35, based on an average price of $1,307,658 and lease rate of $3,143 – indicating the purchase price is about 35 years of today’s average annual rent.
East and West End Neighbourhoods Offer Pockets of Opportunity to Renters Seeking Home Ownership
Of all 35 neighbourhoods studied, the 2 neighbourhoods offering the strongest case for buying over renting are E03 (East York, Danforth Village) and E10 (West Hill, Centennial Scarborough) – renters in these neighbourhoods could consider the leap into home ownership. With a PTRR of 15, the average condo purchase price is equal to 15 years worth of rent in both neighbourhoods. Additionally, E11 (Malvern, Rouge) with a PTRR of 17, rounds out the top 3 neighbourhoods that may offer housing opportunities that favour buying a condo apartment over renting one.
In the west end, neighbourhoods that may call for buying over renting with PTRRs of 17 include W05 (Black Creek, York University Heights) where the average price was $434,340 and average lease rate was $2,140, and W10 (Rexdale-Kipling, West Humber-Claireville) where the average price was $438,047 and lease rate of $2,124.
Other Factors to Consider When Deciding Whether to Rent or Buy
While the price-to-rent ratio is helpful for potential home buyers and renters as they weigh their next move and compare neighbourhoods, it’s far from the only factor to consider when determining next steps. For nearly every prospective buyer or renter, the decision involves their personal financial objectives and lifestyle goals. With that in mind, there are advantages (and disadvantages) to purchasing vs. leasing. For example, the benefits of purchasing a home include the pride of home ownership and potential appreciation in the value of the property over the long term. On the other hand, renters have more flexibility to move, don’t have a large amount of equity tied to one asset, and less responsibility for home maintenance and repairs. As it pertains to their personal decision, it’s important that prospective buyers and renters consult with a professional to help determine what best meets their needs.
Our infographic below highlights the purchase prices, lease rates and the price-to-rent ratio (PTRR) for 35 City of Toronto neighbourhoods. The PTRR represents the years of today’s rent the purchase price is equal to. Further below are lists of neighbourhoods with the highest PTRRs and neighbourhoods with the lowest PTRRs.
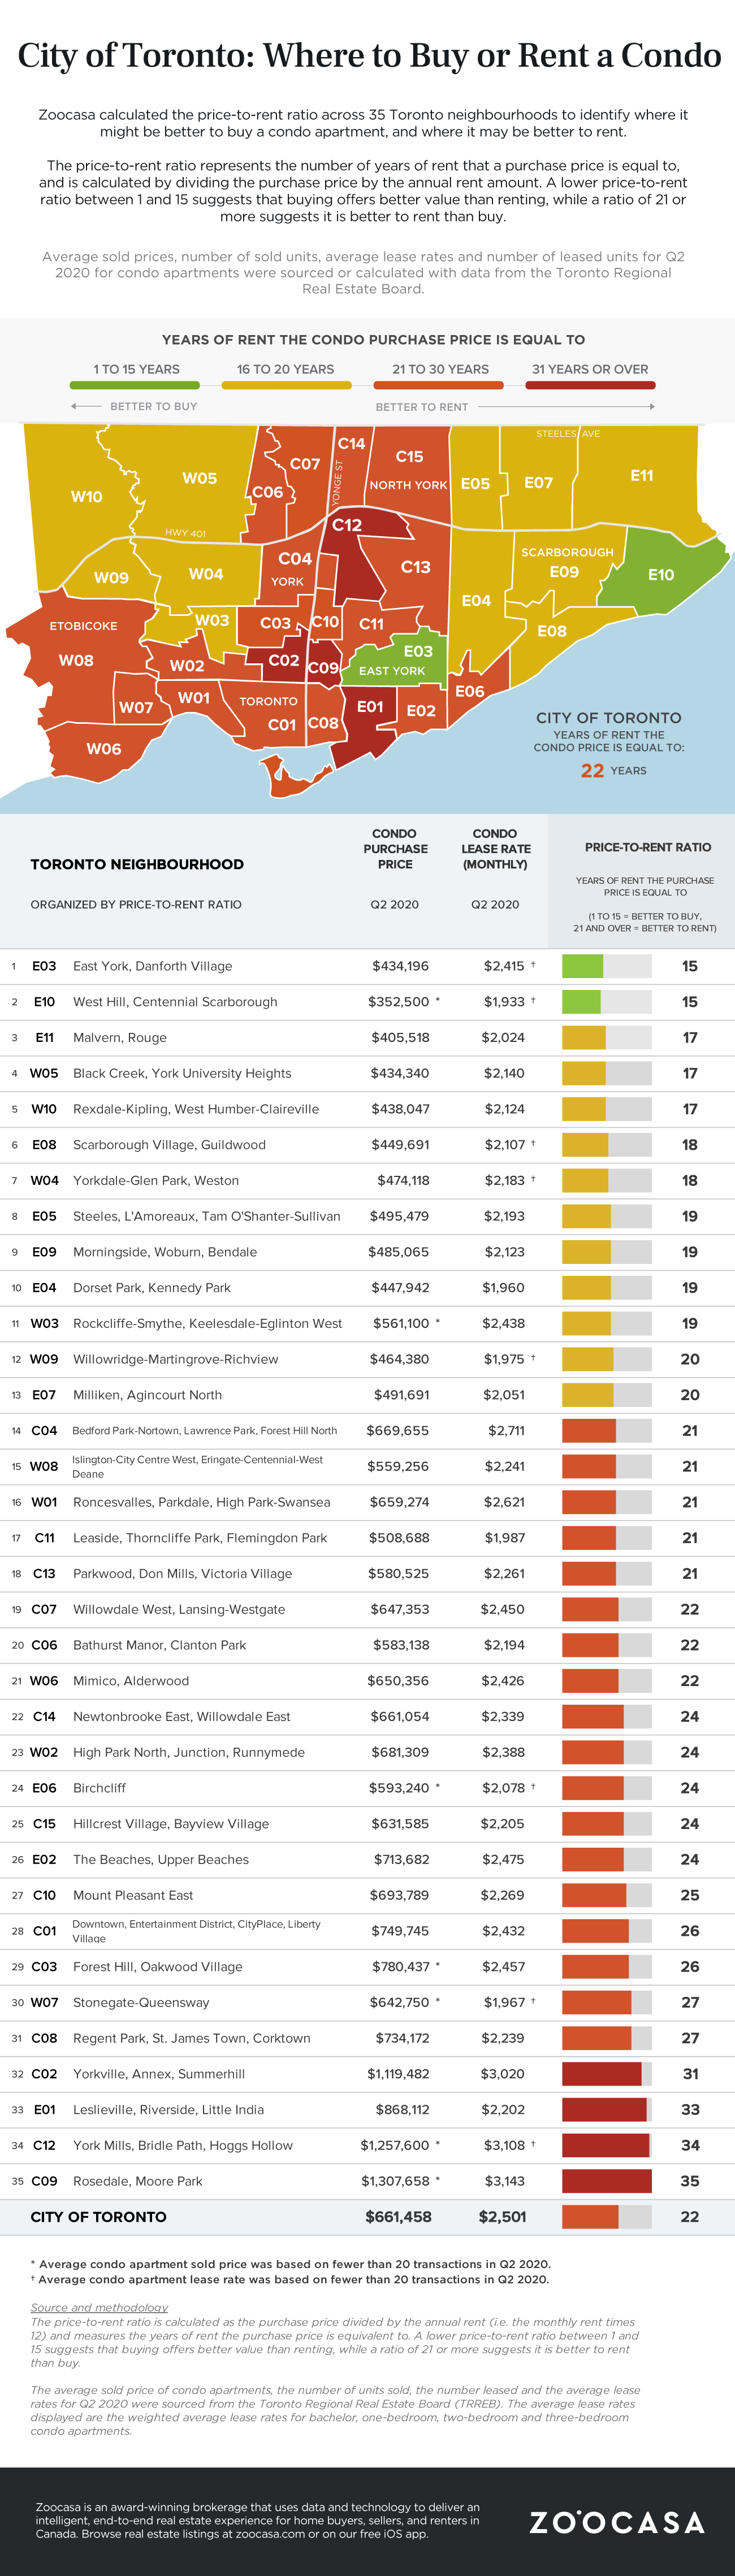
Table of Price-To-Rent Ratio of 35 Toronto Neighbourhoods
| Rank | Toronto Neighbourhood | Condo Purchase Price | Condo Lease Rate (Monthly) | Price-to-Rent Ratio |
|---|---|---|---|---|
| 1 | East York, Danforth Village | $434,196 | $2,415 | 15 |
| 2 | West Hill, Centennial Scarborough | $352,500 | $1,933 | 15 |
| 3 | Malvern, Rouge | $405,518 | $2,024 | 17 |
| 4 | Black Creek, York University Heights | $434,340 | $2,140 | 17 |
| 5 | Rexdale-Kipling, West Humber-Claireville | $438,047 | $2,124 | 17 |
| 6 | Scarborough Village, Guildwood | $449,691 | $2,107 | 18 |
| 7 | Yorkdale-Glen Park, Weston | $474,118 | $2,183 | 18 |
| 8 | Steeles, L'Amoreaux, Tam O'Shanter-Sullivan | $495,479 | $2,193 | 19 |
| 9 | Morningside, Woburn, Bendale | $485,065 | $2,123 | 19 |
| 10 | Dorset Park, Kennedy Park | $447,942 | $1,960 | 19 |
| 11 | Rockcliffe-Smythe, Keelesdale-Eglinton West | $561,100 | $2,438 | 19 |
| 12 | Willowridge-Martingrove-Richview | $464,380 | $1,975 | 20 |
| 13 | Milliken, Agincourt North | $491,691 | $2,051 | 20 |
| 14 | Bedford Park-Nortown, Lawrence Park, Forest Hill North | $669,655 | $2,711 | 21 |
| 15 | Islington-City Centre West, Eringate-Centennial-West Deane | $559,256 | $2,241 | 21 |
| 16 | Roncesvalles, Parkdale, High Park-Swansea | $659,274 | $2,621 | 21 |
| 17 | Leaside, Thorncliffe Park, Flemingdon Park | $508,688 | $1,987 | 21 |
| 18 | Parkwood, Don Mills, Victoria Village | $580,525 | $2,261 | 21 |
| 19 | Willowdale West, Lansing-Westgate | $647,353 | $2,450 | 22 |
| 20 | Bathurst Manor, Clanton Park | $583,138 | $2,194 | 22 |
| 21 | Mimico, Alderwood | $650,356 | $2,426 | 22 |
| 22 | Newtonbrooke East, Willowdale East | $661,054 | $2,339 | 24 |
| 23 | High Park North, Junction, Runnymede | $681,309 | $2,388 | 24 |
| 24 | Birchcliff | $593,240 | $2,078 | 24 |
| 25 | Hillcrest Village, Bayview Village | $631,585 | $2,205 | 24 |
| 26 | The Beaches, Upper Beaches | $713,682 | $2,475 | 24 |
| 27 | Mount Pleasant East | $693,789 | $2,269 | 25 |
| 28 | Downtown, Entertainment District, CityPlace, Liberty Village | $749,745 | $2,432 | 26 |
| 29 | Forest Hill, Oakwood Village | $780,437 | $2,457 | 26 |
| 30 | Stonegate-Queensway | $642,750 | $1,967 | 27 |
| 31 | Regent Park, St. James Town, Corktown | $734,172 | $2,239 | 27 |
| 32 | Yorkville, Annex, Summerhill | $1,119,482 | $3,020 | 31 |
| 33 | Leslieville, Riverside, Little India | $868,112 | $2,202 | 33 |
| 34 | York Mills, Bridle Path, Hoggs Hollow | $1,257,600 | $3,108 | 34 |
| 35 | Rosedale, Moore Park | $1,307,658 | $3,143 | 35 |
5 Neighbourhoods with Highest Price-to-Rent Ratio (PTRR), Q2 2020
- C09 – Rosedale, Moore Park
Condo purchase price: $1,307,658
Condo lease rate: $2,501
PTRR: 35 - C12 – York Mills, Bridle Path, Hoggs Hollow
Condo purchase price: $1,257,600
Condo lease rate: $3,108
PTRR: 34 - E01 – Leslieville, Riverside, Little India
Condo purchase price: $868,112
Condo lease rate: $2,202
PTRR: 33 - C02 – Yorkville Annex, Summerhill
Condo purchase price: $1,119,482
Condo lease rate: $3,020
PTRR: 31 - C08 – Regent Park, St. James Town, Corktown
Condo purchase price: $734,172
Condo lease rate: $2,239
PTRR: 27
5 Neighbourhoods with the Lowest Price-to-Rent Ratio (PTRR), Q2 2020
- E03 – East York, Danforth Village
Condo purchase price: $434,196
Condo lease rate (monthly): $2,415
PTRR: 15 - E10 – West Hill, Centennial Scarborough
Condo purchase price: $352,500
Condo lease rate (monthly): $1,933
PTRR: 15 - E11 – Malvern, Rouge
Condo purchase price: $405,518
Condo lease rate (monthly): $2,024
PTRR: 17 - W05 – Black Creek, York University Heights
Condo purchase price: $434, 340
Condo lease rate (monthly): $2,140
PTRR: 17 - W10 – Rexdale-Kipling, West Humber-Claireville
Condo purchase rate: $438,047
Condo lease rate: $2,124
PTRR: 17
Sources and Methodology
The price-to-rent ratio is calculated as the purchase price divided by the annual rent (i.e. the monthly rent times 12) and measures the years of rent the purchase price is equivalent to. A lower price-to-rent ratio between 1 and 15 suggests that buying offers better value than renting, while a ratio of 21 or more suggests it is better to rent than buy.
The average sold price of condo apartments, the number of units sold, the number leased and the average lease rates for Q2 2020 were sourced from the Toronto Regional Real Estate Board (TRREB). The average lease rates displayed are the weighted average lease rates for bachelor, one-bedroom, two-bedroom and three-bedroom condo apartments.
Contact
For more information about this report or to set up a media interview, please contact communications@zoocasa.com.