The Toronto housing market has seen a world of change in recent years – factors such as a strong economy, heavy migration, low rental vacancy, as well as investment in real estate as an asset, have had a too-hot-to-handle impact on average home prices in the city. According to data from the Toronto Real Estate Board, the average home buyer would need to shell out $256,055 more for a home in July 2019 compared to 2014, an increase of 46% and a price tag of $806,755.
And, while provincial and federal policies introduced to cool the market have had a pulldown effect on sales and price growth between late 2017 – mid 2018, new analysis from Zoocasa finds that, over a five-year time period, dramatic price increases have persisted in pockets across the city.
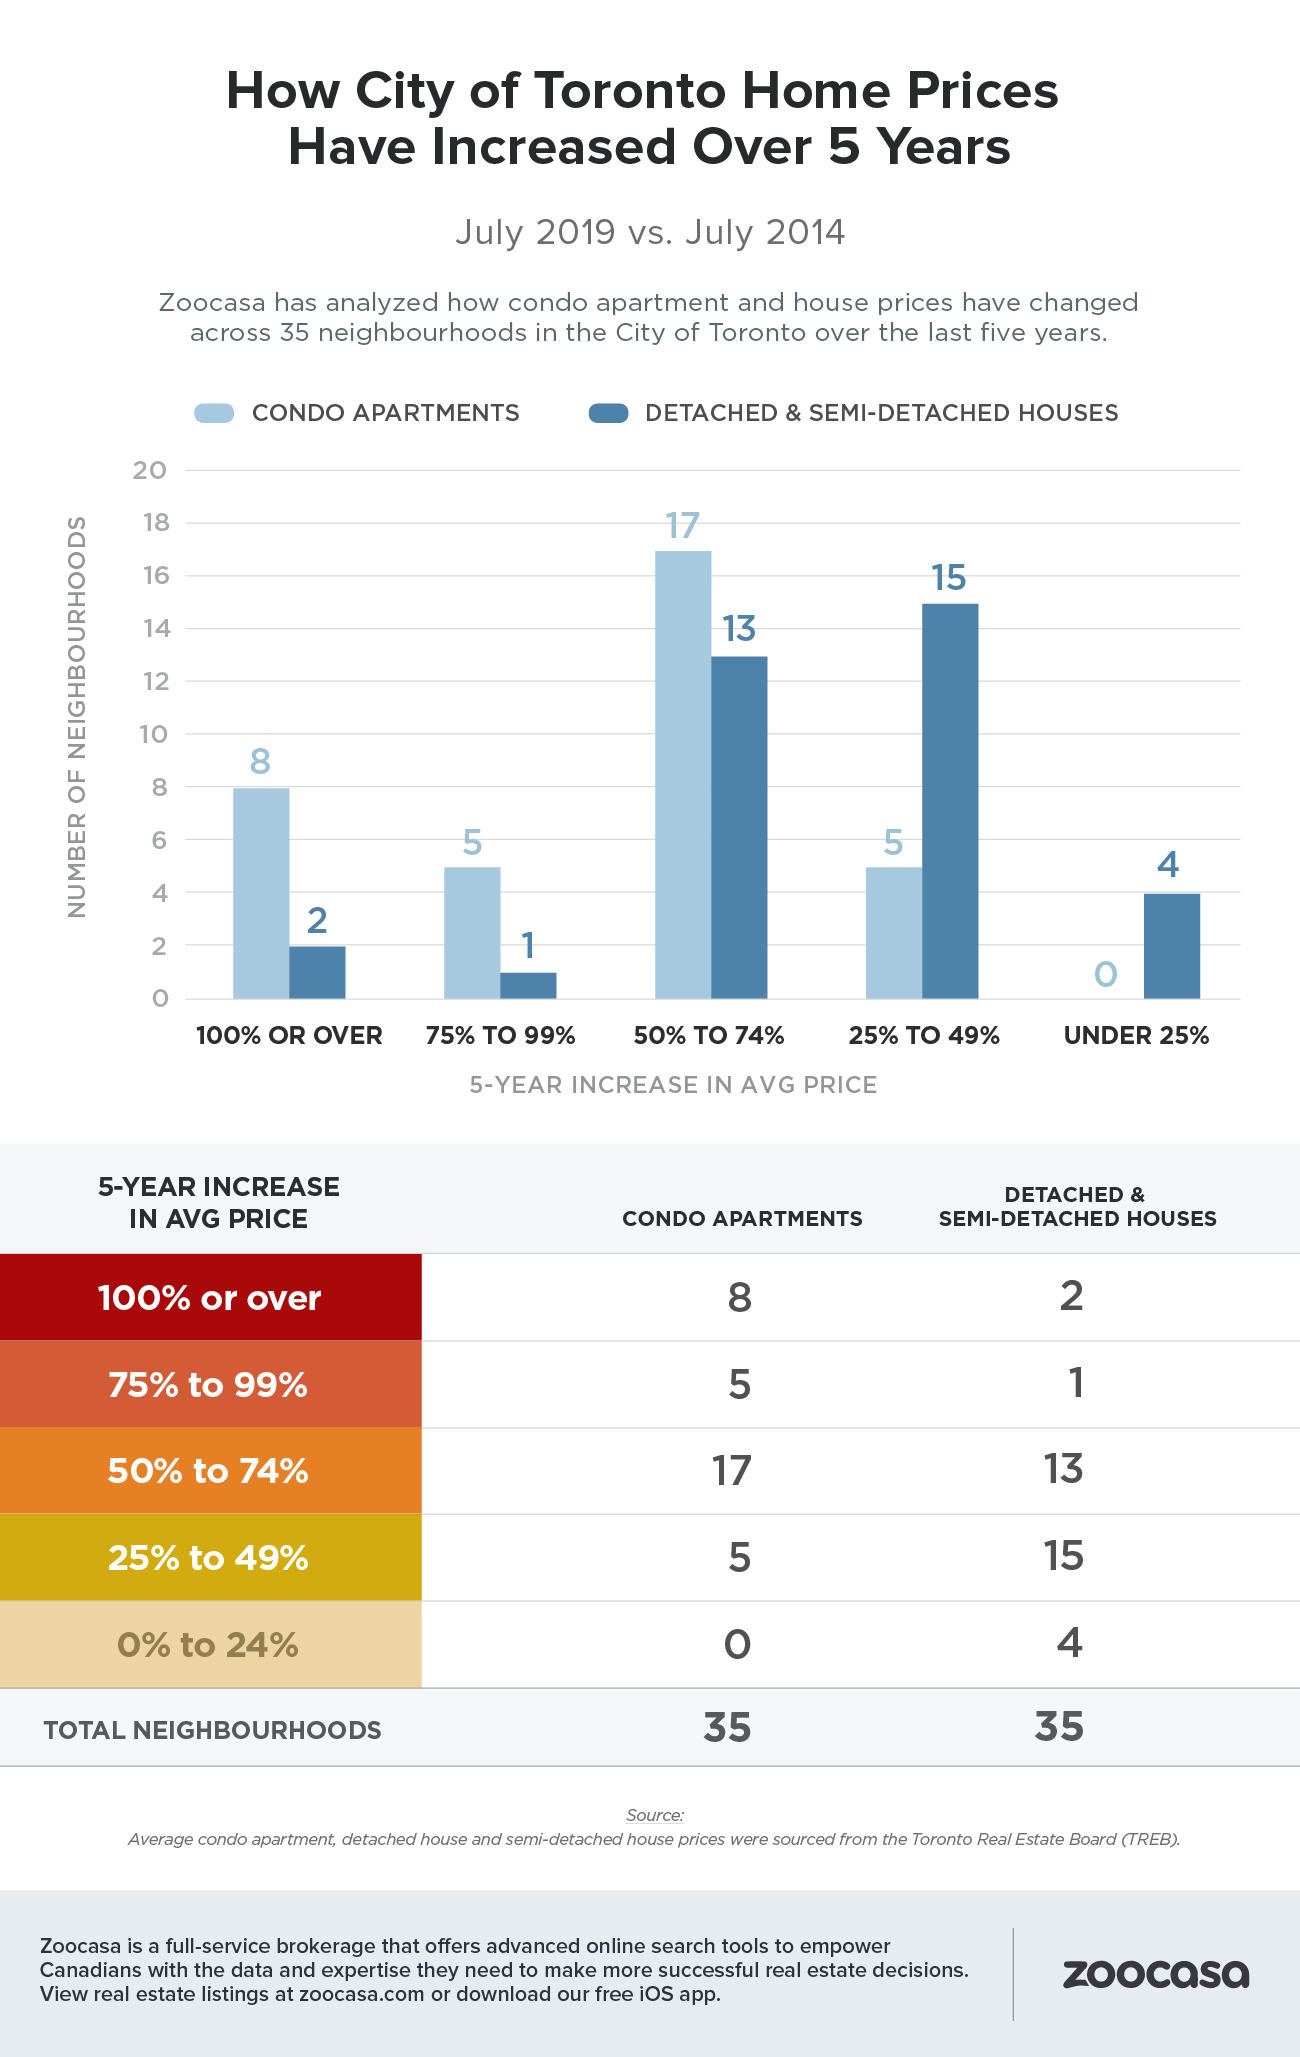
The study, which crunched the difference in average home prices for condos and houses in 35 MLS districts in Toronto, reveals prices have more than doubled in a number of neighbourhoods, especially in the condo market and areas with prices lower than the city average.
Here’s a count of how prices have increased across the City of Toronto during the five-year time frame:
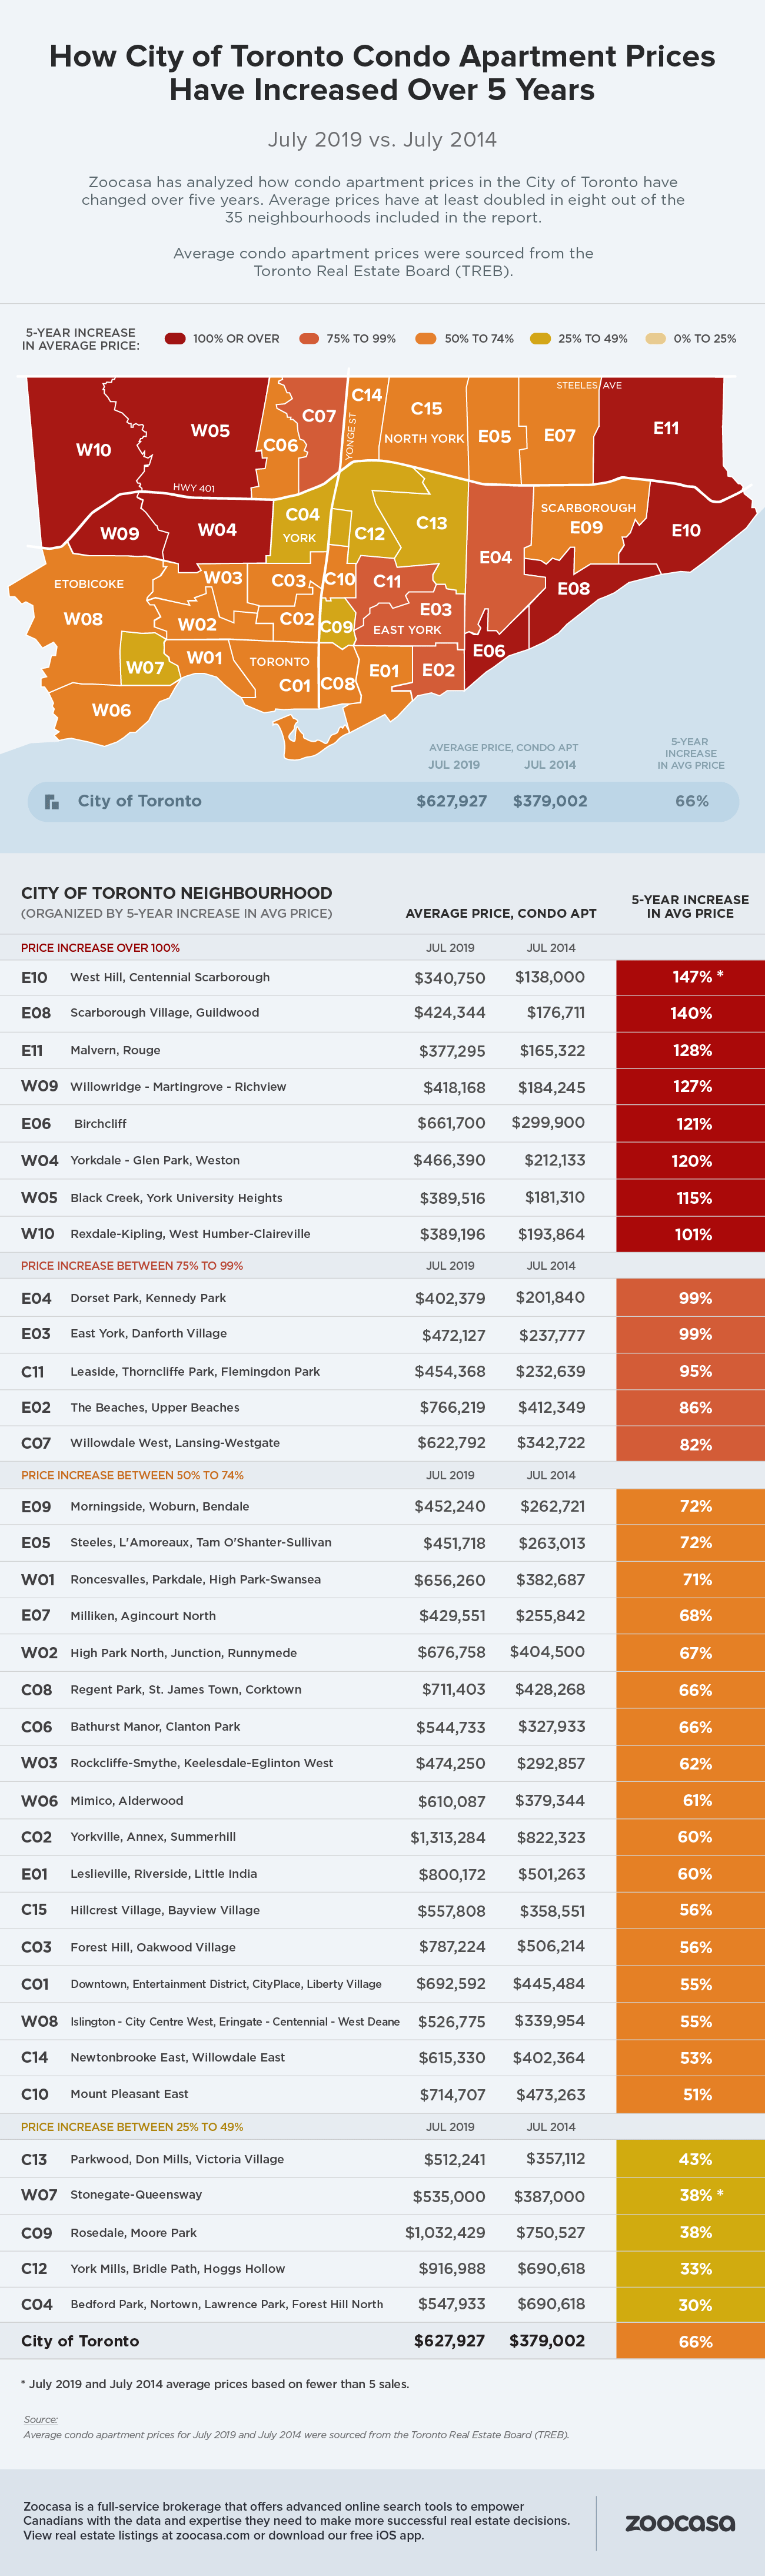
Condo Price Increases Concentrated in East and Northwest
Toronto condos have long led the market in terms of price growth, with a greater proportion of local markets experiencing dramatic upswings during the five-year period.
While the overall average condo price increased 66% to $627,927 between 2015 – 2019, eight of the assessed neighbourhoods have seen appreciation of 100% or greater; 30 of 35 have experienced at least a 50% increase, while all have seen prices tick up by a minimum of 25%.
Neighbourhoods with condos priced below the city average saw the sharpest increase over the time frame; of the neighbourhoods that doubled, seven of eight remain priced below the $500,000-mark in
Rather, units located within the city’s downtown core or close to transit hubs saw the greatest volume of sales, such as City Place, Cabbagetown, and Mimico, despite being at a higher price point between $520,000 – $711,000.
While this speaks to
Neighbourhoods Where Condo Prices Doubled
- E10 – West Hill, Centennial Scarborough: +147%
- July 2019 Average condo price: $340,750
- Sales: 4 New Listings: 9
- E08 – Scarborough Village, Guildwood: +140%
- July 2019 Average condo price: $424,344
- Sales: 16 New Listings: 27
- E11 – Malvern, Rouge: +128%
- July 2019 Average condo price: $377,295
- Sales: 20 New Listings: 29
- W09 – Willowridge – Martingrove – Richview: +127%
- July 2019 Average condo price: $418,168
- Sales: 11 New Listings: 20
- E06 – Birchcliff: +121%
- July 2019 Average condo price: $661,700
- Sales: 5 New Listings: 16
- W04 – Yorkdale, Glen Park, Weston: +120%
- July 2019 Average condo price: $466,390
- Sales: 26 New Listings: 37
- W05 – Black Creek, York University Heights: +115%
- July 2019 Average condo price: $389,516
- Sales: 25 New Listings: 40
- W10 – Rexdale-Kipling, West Humber-Claireville: +101%
- July 2019 Average condo price: $389,196
- Sales: 28 New Listings: 62
Houses See More Moderate Price Increase
Price growth was less pronounced for houses for sale in Toronto, though still robust; the average price of detached and semi-detached houses rose 42% over the five-year period to $1,167,968, with the bulk of neighbourhoods experiencing a 25 – 49% uptick in prices (15 neighbourhoods) and between 50 – 74% (13 neighbourhoods). Four saw an increase between 18 – 24%, while just three saw increases above the 75% mark.
Of those three, two MLS districts saw prices double – C03, which includes Forest Hill and Oakwood, and C08, which encompasses Regent Park, St. James Town, and Corktown. However, there are
In contrast, detached and semi-detached houses for sale are in very scarce supply in C08, with just four sales and five listings over the course of the month. That effectively puts upward pressure on prices, which are at an average of $1,789,032, despite it being a very small market for single-family housing.
However, house buyers continue to be most drawn to lower-priced
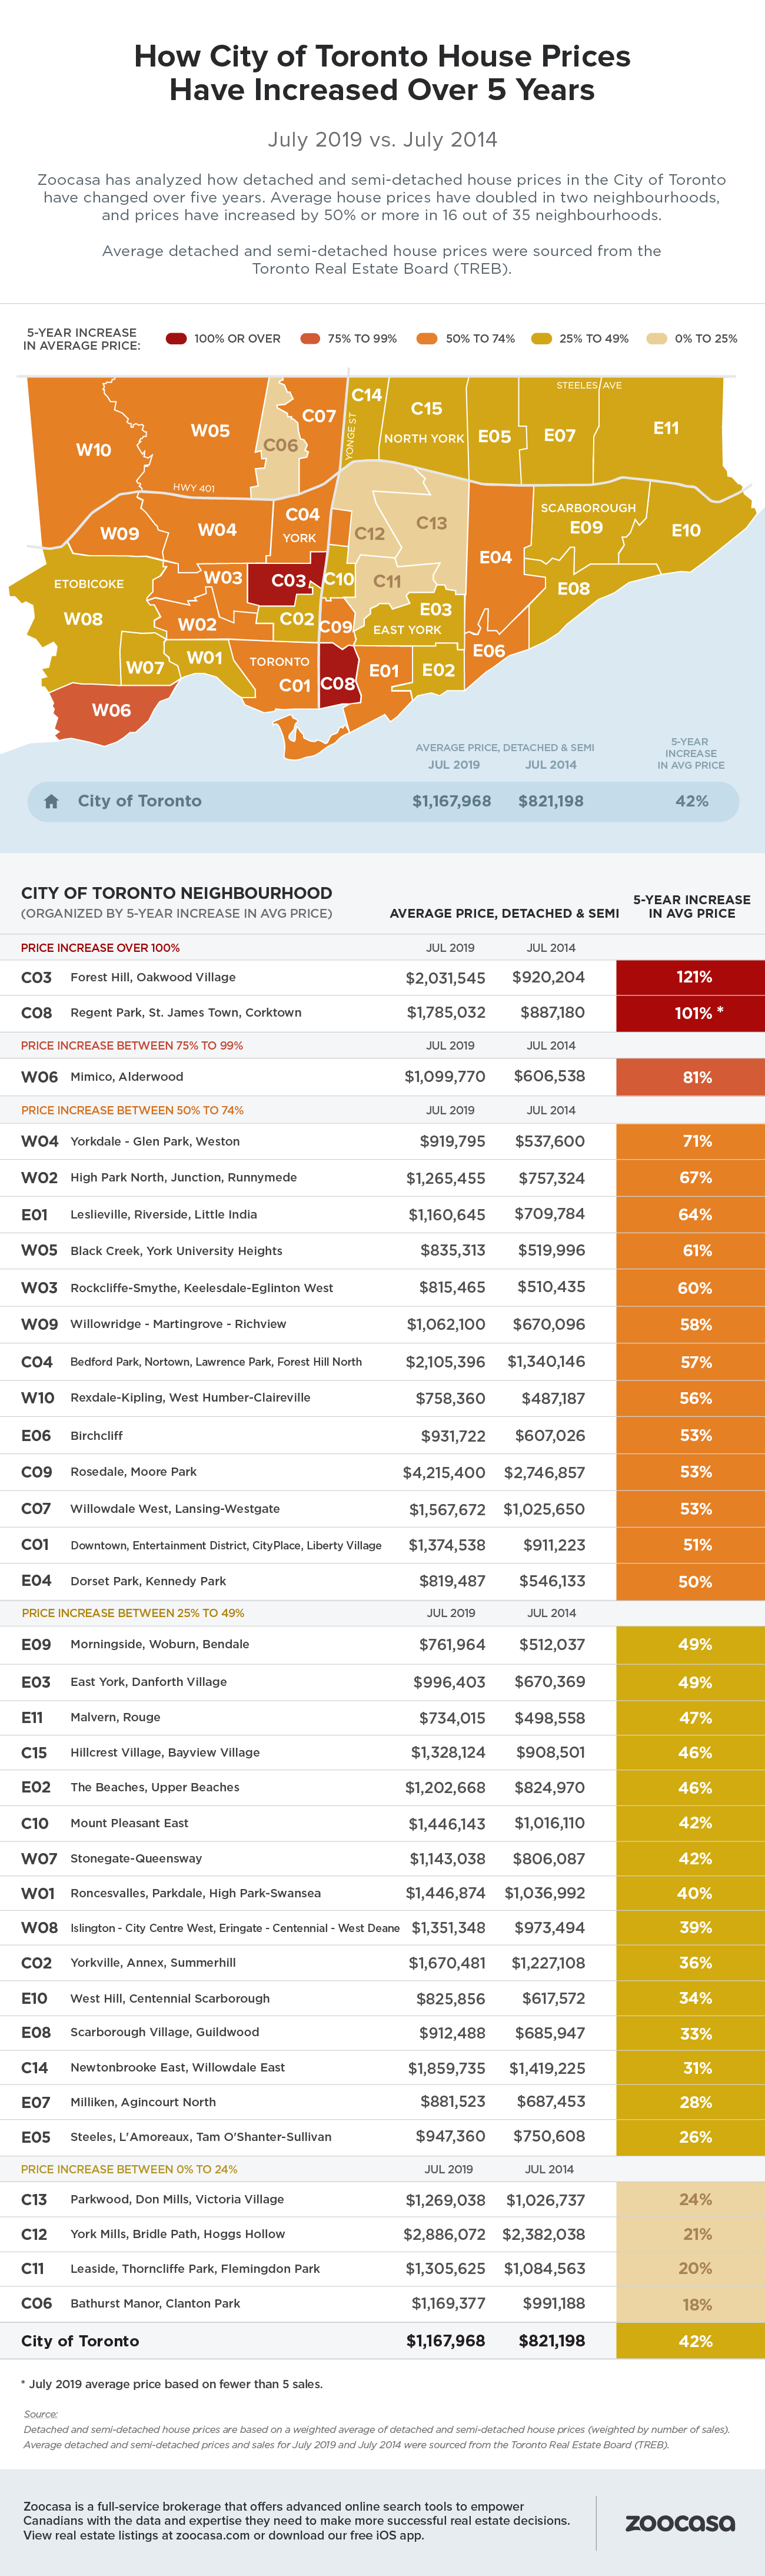
Neighbourhoods Where House Prices Doubled
- C03 – Forest Hill, Oakwood: +121%
- July 2019 Average condo price: $2,031,545
- Sales: 30 New Listings: 44
- C08 – Regent Park, St. James Town, Corktown: +101%
- July 2019 Average condo price: $1,785,032
- Sales: 4 New Listings: 5
—
Sources
Sales, new listings and average prices for condo apartments, detached houses and semi-detached houses were sourced from the Toronto Real Estate Board (TREB).
About Zoocasa
Zoocasa.com is a real estate website that provides advanced online search tools and data to empower Canadians to buy or sell their homes faster, easier and more successfully. Home buyers can browse real estate listings on the website or the free iOS app.
For more information about this report or to set up a media interview, please email communications@zoocasa.com.