
Interest rate increases have caused downward pressure on home prices across Canada. Since the first announcement in March following the housing price peak, prospective buyers have been understandably hesitant to enter the market and less willing to part with their money. At the beginning of 2022, many homes were selling over asking price; while the market was competitive and the cost of borrowing was low, sellers were eager to list. The seventh and final interest rate increase of 2022 was announced yesterday, and with the cost of borrowing increasing by 4.25 basis points total this year, many homes are selling for under the listing price, especially in Toronto and the Greater Toronto Area (GTA). To see how the landscape has changed, we analyzed listing prices and selling prices in the Toronto region, to understand just how much homes are selling for below the asking price.
Properties in 24 of the 31 Cities are Selling for Under the Listing Price
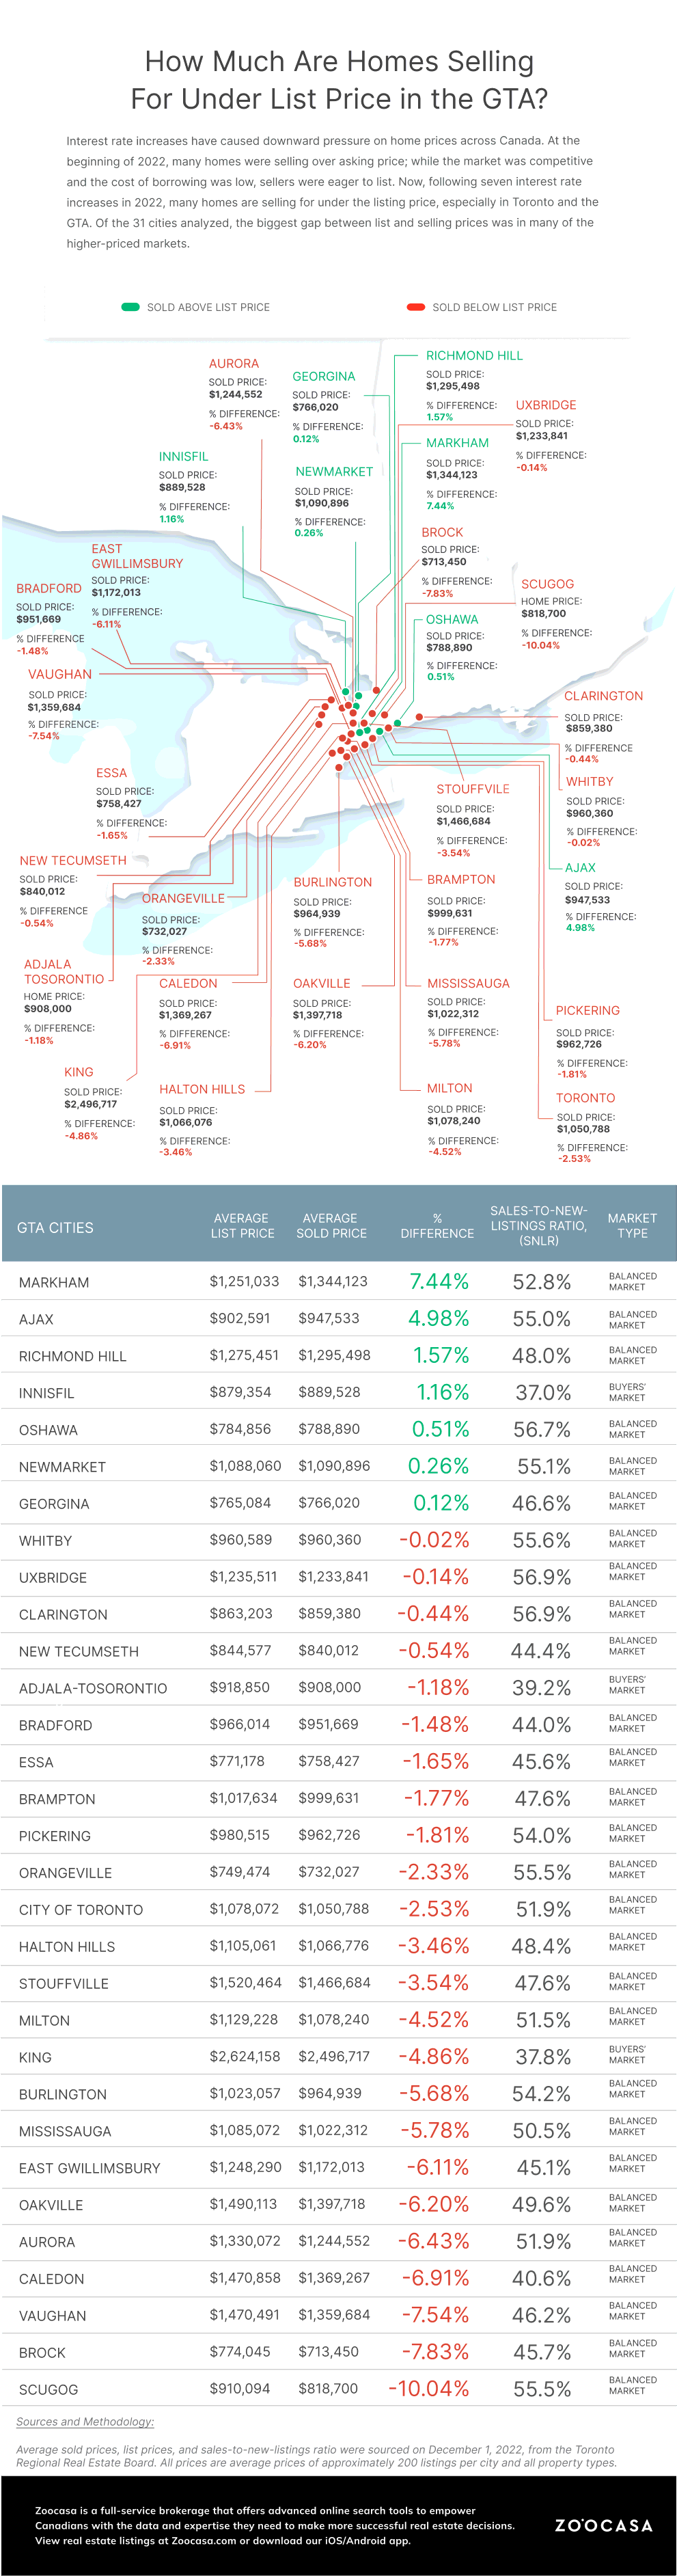
Prospective buyers will be happy to hear that as of November, prices in the Toronto region are down 7.2% year-over-year. Many of the higher-priced markets are experiencing the biggest gap between list and selling prices; in Mississauga, homes are selling for 5.78% under the average list price of just over $1 million. Burlington is following suit at an average listing price of $1,023,057 and an average selling price of $964,939. Although inventory is below the historical average in many of these cities, prospective buyers should consider making their move if they find a property they love at the right price point.
Properties in a handful of cities are selling just below the average listing price. In Uxbridge, the average selling price of $1,233,811 is only 0.14% less than its listing price of $1,235,511. Whitby has the smallest difference between its average listing price of $960,589 and sale price of $960,360, only 0.02% difference. Of the 31 cities covered, 16 of them had a difference of less than 3% between their listing and sold prices.
- Related Read: 3 Steps to Determine What Your Home is Worth
In Scugog, the difference between average selling and listing prices is the greatest of all the GTA cities. Homes were listed for an average of $910,094 and sold for $818,700, a difference of 10.04%. Brock is right behind Scugog on our list, with a 7.83% difference between the listing price of $774,045 and the selling price of $713,450. Of the 15 cities where homes are selling for over $1,000,000, just two of the cities have higher average selling prices than listing prices, suggesting that buyer bullishness is greater in these more expensive markets.
Few Markets Have Higher Sold Prices than Listing Prices
There are only seven markets where homes are selling for higher than the average listing price. In Markham, the average selling price is $1,344,123, 7.44% greater than the list price of $1,251,033. Ajax is next in line with a difference of 4.98%, while the other five cities are all selling for around 2% more than the average listing price. Despite this, it is worth noting that only a few of these markets are currently favouring buyers. The sales-to-new-listings (SNLR) ratio determines whether a market is more beneficial to buyers (40% or less), sellers (60% or more), or if it’s in a state of balance (between 40% and 60%). Oshawa’s SNLR of 56.1%, indicates that the market is in a balanced state. However, none of the 31 markets we analyzed are currently in a seller’s market, and just three are in a buyer’s market (King, Innisfil, and Adjala-Tosorontio).
Although many Canadians have been priced out of the market due to rising interest rates, there are still deals to be found, even in the GTA! Give us a call today to speak to a real estate agent in your area and discuss your home buying and/or selling plans. Keep an eye on our Market Insights blog for our predictions about what’s to come in 2023 and sign up for our newsletter to get updates sent directly to your inbox.
We want to hear from you! Share your opinion regarding the 2023 Canadian real estate market? Fill out this quick 45-second survey by Friday, December 9 – all responses are collected anonymously.
Sources and Methodology:
Average sold prices, list prices, and sales-to-new-listings ratio were sourced on December 1, 2022, from the Toronto Regional Real Estate Board. All prices are average prices of approximately 200 listings per city and all property types.