Below is the 2019 edition of Ontario Cities with the Highest and Lowest Property Tax Rates report originally published August 1, 2019. Visit our 2021 Ontario property tax rate ranking for the most recent findings, published November 10, 2021.
For those considering a new home purchase, the decision is generally ruled by their home buying budget; the property’s listing price, as well as the resulting monthly mortgage payments, utility costs, and closing costs such as land transfer tax, are all carefully weighed. However, the amount of property tax a buyer will need to pay is a considerable carrying cost that’s often overlooked, despite it being an ongoing annual financial obligation over the course of the home’s ownership.
The amount of property tax paid should also be of particular note to buyers moving to a new city, as municipal tax rates vary widely across Ontario; the difference paid annually can be thousands of dollars depending on the size of the city, its council’s operating budget, and even factors such as the health of its housing market.
Do you have questions about how property taxes work? Check out our property tax FAQs for home buyers here.
In fact, according to calculations from Zoocasa, an Ontario homeowner living in Windsor, the city with the highest tax rate at 1.789394%, would pay $5,873 more per year in property tax on a home assessed at $500,000 than one in the City of Toronto, which has the lowest tax rate in the province at 0.614770%.
Related Read: GTA Cities With the Highest Property Tax Rates
How is Property Tax Calculated?
In short, the amount you’ll pay in property tax can be calculated by multiplying your most recent home value assessment by the residential rate set by your local municipality. In the province of Ontario, these are based on the following:
- The value of your home, as assessed by the Municipal Property Assessment Corporation (MPAC). This assessment takes into account a combination of factors about your home such as its lot size, whether it has a basement, and if its condition has been improved with renovations and other structural updates. Whether or not it has any special features, such as a pool, is also taken into consideration, as well as the values of comparable properties in the neighbourhood.
The latter is especially important forhome buyers in rapidly appreciating neighbourhoods; surging local home prices over a short period of time can lead to a shock when the tax bill is opened the following year.
- The Education Tax Rate, implemented by the province of Ontario, the proceeds of which are used to fund regional schools.
- The Residential Tax Rate, which is determined annually by a municipality’s city council.
Why Do Property Taxes Vary from City to City?
As a main purpose of property tax collection is to generate revenue for cities, individual city councils generally set it at a rate that will bring in sufficient cash to float their operating budgets. However, they have considerable flexibility on this; in Toronto, for instance, city council has purposely kept the residential tax rate below inflation as a promise to voters. Keeping property taxes low can also act as an incentive to draw more buyers to a city’s property market.
Real Estate Values Contribute to Property Tax Policy
Cities with high-valued local real estate and larger populations generally have more leeway on keeping their tax rate low, as the amount collected from individual homeowners is higher to reflect real estate prices, and there are more tax payers to contribute to the pot. For example, as Toronto real estate prices continue to rise (hitting an average of $915,481 in June), so too do property tax revenues, giving council the ability to keep the rate low.
It’s a similar dynamic seen for Markham and Milton homes for sale; in these cities, which round out the lowest three for tax rates at 0.659822% and 0.6857761%, respectively, comparably higher average home prices of $914,776 and $775,964 allow for overall lower tax rates.
In contrast, the cities with the highest tax rates often have the lowest-priced real estate. Condos and houses for sale in Oshawa, for instance, currently sell at an average of $536,513, and come with a tax rate of 1.344725%. In Windsor, Thunder Bay, and Sault Ste. Marie – the three highest-taxed cities in the range of 1.7% – 1.5% – average home prices remain well below the $350,000-mark.
Another factor is the city’s commercial-to-residential tax ratio; in most municipalities, businesses pay at least double the amount of tax than homeowners, with the Canadian average at 2.85. Generally, a higher commercial property tax rate translates to a lower residential rate, and vice-versa; a local council may opt to hike the latter if they feel their community needs to offer more competitive advantages to businesses.
How Property Tax Rates Rank Across Ontario
Check out the infographic below to see which Ontario real estate markets have the lowest – and highest – property tax rates, and what homeowners could expect to pay based on sample assessments of $250,000, $500,000, and $1,000,000.
Property tax rates were sourced from each municipality’s website. June 2019 home prices were sourced from each region’s real estate board.
Cities With the Lowest Property Tax Rates in Ontario, 2019
- Toronto: 0.614770%
- Markham: 0.659822%
- Milton: 0.685776%
- Richmond Hill: 0.688357%
- Vaughan: 0.696147%
Cities With the Highest Property Tax Rates in Ontario, 2019
- Windsor: 1.789394%
- Thunder Bay: 1.598484%
- Sault Ste. Marie: 1.529349%
- North Bay: 1.501246%
- Sudbury: 1.461888%
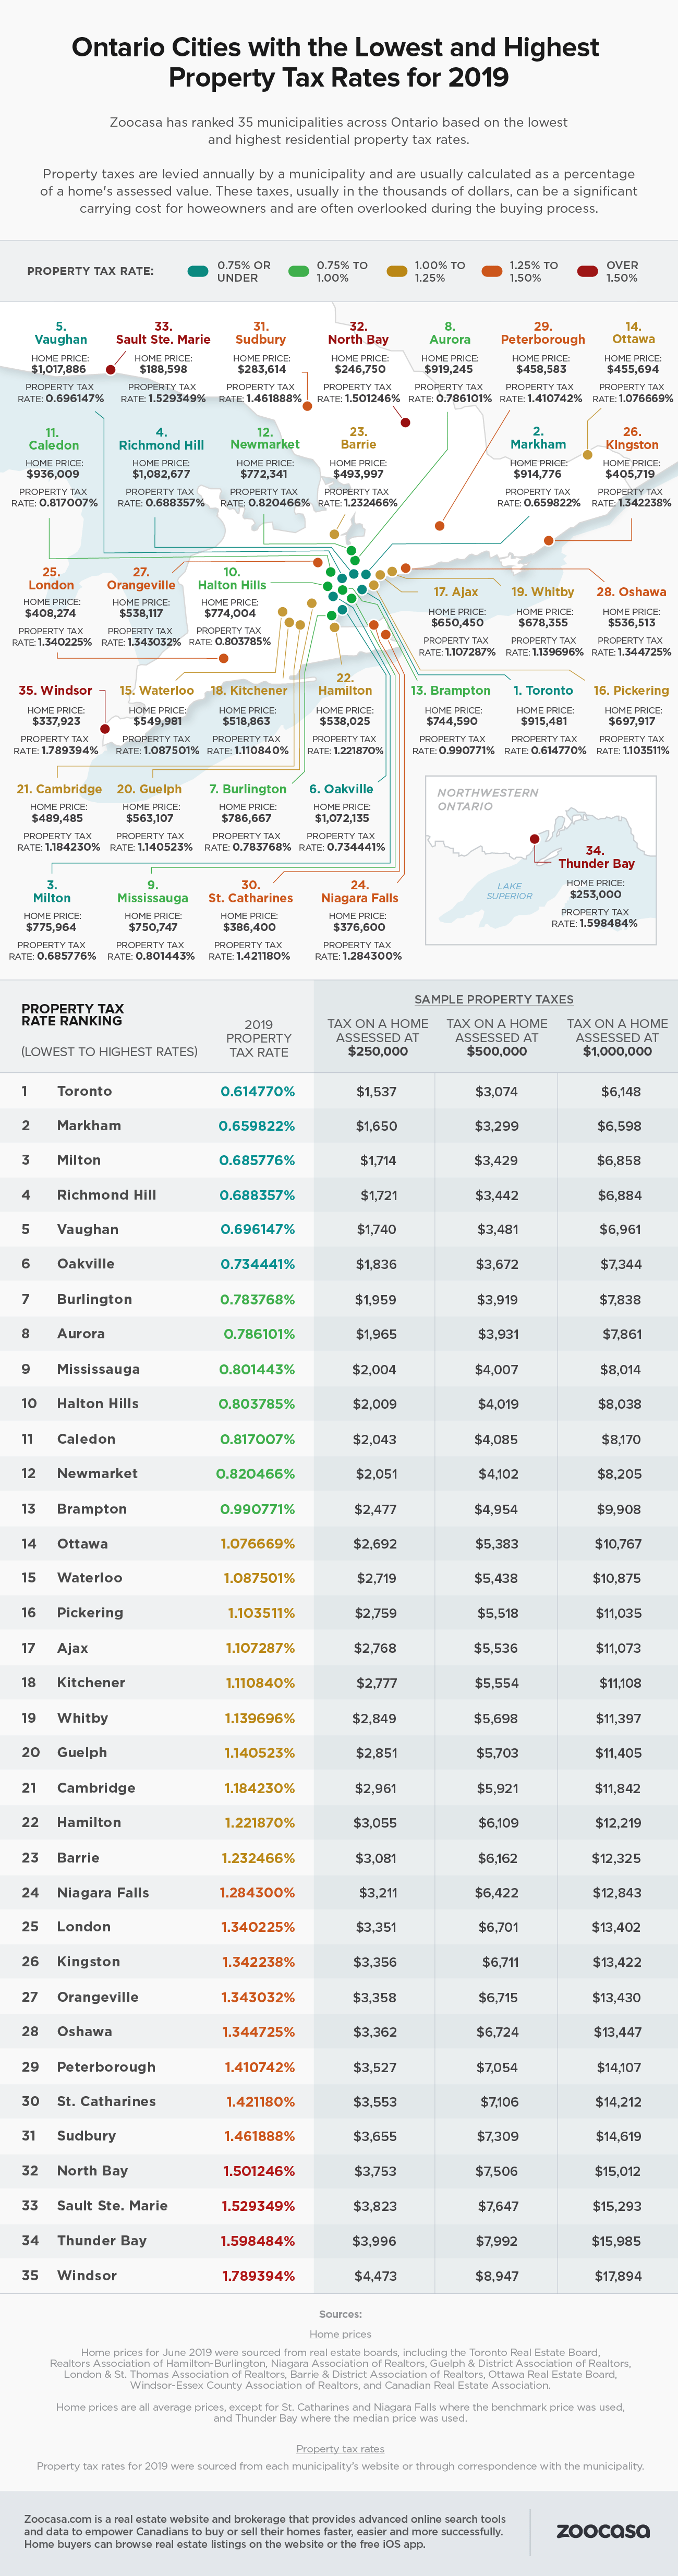
Table of Ontario Property Tax Rates for 2019
| Ranking by Rate (%) | Municipality | Property Tax Rate (%) | Property Tax on Home Assessed at $250,000 | Property Tax on Home Assessed at $500,000 | Property Tax on Home Assessed at $1,000,000 |
|---|---|---|---|---|---|
| 1 | Toronto | 0.614770% | $1,537 | $3,074 | $6,148 |
| 2 | Markham | 0.659822% | $1,650 | $3,299 | $6,598 |
| 3 | Milton | 0.685776% | $1,714 | $3,429 | $6,858 |
| 4 | Richmond Hill | 0.688357% | $1,721 | $3,442 | $6,884 |
| 5 | Vaughan | 0.696147% | $1,740 | $3,481 | $6,961 |
| 6 | Oakville | 0.734441% | $1,836 | $3,672 | $7,344 |
| 7 | Burlington | 0.783768% | $1,959 | $3,919 | $7,838 |
| 8 | Aurora | 0.786101% | $1,965 | $3,931 | $7,861 |
| 9 | Mississauga | 0.801443% | $2,004 | $4,007 | $8,014 |
| 10 | Halton Hills | 0.803785% | $2,009 | $4,019 | $8,038 |
| 11 | Caledon | 0.817007% | $2,043 | $4,085 | $8,170 |
| 12 | Newmarket | 0.820466% | $2,051 | $4,102 | $8,205 |
| 13 | Brampton | 0.990771% | $2,477 | $4,954 | $9,908 |
| 14 | Ottawa | 1.076669% | $2,692 | $5,383 | $10,767 |
| 15 | Waterloo | 1.087501% | $2,719 | $5,438 | $10,875 |
| 16 | Pickering | 1.103511% | $2,759 | $5,518 | $11,035 |
| 17 | Ajax | 1.107287% | $2,768 | $5,536 | $11,073 |
| 18 | Kitchener | 1.110840% | $2,777 | $5,554 | $11,108 |
| 19 | Whitby | 1.139696% | $2,849 | $5,698 | $11,397 |
| 20 | Guelph | 1.140523% | $2,851 | $5,703 | $11,405 |
| 21 | Cambridge | 1.184230% | $2,961 | $5,921 | $11,842 |
| 22 | Hamilton | 1.221870% | $3,055 | $6,109 | $12,219 |
| 23 | Barrie | 1.232466% | $3,081 | $6,162 | $12,325 |
| 24 | Niagara Falls | 1.284300% | $3,211 | $6,422 | $12,843 |
| 25 | London | 1.340225% | $3,351 | $6,701 | $13,402 |
| 26 | Kingston | 1.342238% | $3,356 | $6,711 | $13,422 |
| 27 | Orangeville | 1.343032% | $3,358 | $6,715 | $13,430 |
| 28 | Oshawa | 1.344725% | $3,362 | $6,724 | $13,447 |
| 29 | Peterborough | 1.410742% | $3,527 | $7,054 | $14,107 |
| 30 | St. Catharines | 1.421180% | $3,553 | $7,106 | $14,212 |
| 31 | Sudbury | 1.461888% | $3,655 | $7,309 | $14,619 |
| 32 | North Bay | 1.501246% | $3,753 | $7,506 | $15,012 |
| 33 | Sault Ste. Marie | 1.529349% | $3,823 | $7,647 | $15,293 |
| 34 | Thunder Bay | 1.598484% | $3,996 | $7,992 | $15,985 |
| 35 | Windsor | 1.789394% | $4,473 | $8,947 | $17,894 |
Methodology
Home prices:
Home prices for June 2019 were sourced from real estate boards, including the Toronto Real Estate Board, Realtors Association of Hamilton-Burlington, Niagara Association of Realtors, Guelph & District Association of Realtors, London & St. Thomas Association of Realtors, Barrie & District Association of Realtors, Ottawa Real Estate Board, Windsor-Essex County Association of Realtors, and Canadian Real Estate Association. Home prices are all average prices, except for St. Catharines and Niagara Falls where the benchmark price was used, and Thunder Bay where the median price was used.
Property tax rates:
Property tax rates for 2019 were sourced from each municipality’s website or through correspondence with the municipality.
About Zoocasa
Zoocasa.com is a real estate website that provides advanced online search tools and data to empower Canadians to buy or sell their homes faster, easier and more successfully. Home buyers can browse real estate listings on the website or the free iOS app.
For more information about this report or to set up a media interview, please email communications@zoocasa.com.