NOTE: This 2020 report is an update of our 2019 Ontario property tax rate findings.
The decision to purchase a home is often strongly guided by a home buyer’s budget: from the down payment, monthly mortgage payments, utility costs, and closing costs such as land transfer tax. Additionally, the cost of property tax a buyer will need to pay is also worth considering, and it is often overlooked despite being an ongoing annual financial obligation over the course of the home’s ownership.
Why Should Home Buyers Consider Property Taxes?
While property taxes may not be the largest influence when deciding how much to spend on a property or what municipality to buy a home, the costs are worth understanding as they amount to thousands of dollars per year.
In 2020 in particular, a number of home buyers in the Toronto area have elected to trade their urban condos for bigger homes in municipalities across Ontario. It’s important for buyers who are moving to a new municipality to note that the property tax rate their home is subject to and the total amount they pay in taxes every year will change as municipal tax rates vary widely across Ontario. Depending on the municipality, the difference paid annually can be thousands of dollars depending on the size of the city, its council’s operating budget, and even factors such as the health of its housing market.
Zoocasa compiled 2020 property tax rates for 35 Ontario municipalities, and also calculated what homeowners would pay in taxes in each region at three sample assessment values: $250,000, $500,000 and $1,000,000.
Our findings show, perhaps unsurprisingly, that for homes with the same assessed value, there is a significant variance in the annual property tax amount paid by homeowners, depending on where they live. For example, in Windsor – which features the highest property tax rate among the municipalities included on our list at 1.775679% – a homeowner would pay $8,878 per year in property taxes on a home assessed at $500,000. By comparison, in the City of Toronto – which has the lowest tax rate at 0.599704% among the municipalities included on our list – a homeowner would pay a comparatively lower $2,999 for a property assessed at $500,000.
It’s important to note that this does not mean that every homeowner in Windsor is paying more in property taxes than a homeowner in Toronto. There are a number of factors at play, as we explain below. Further, it is also important to keep in mind that a lower or higher property tax rate and amount shouldn’t be the only indicator that guides a home buying decision. Buyers should consider the big picture of their lifestyle and financial needs when determining what properties, budget or cities fit them best; property taxes are just one financial consideration to be aware of.
How is Property Tax Calculated?
In short, the amount you’ll pay in property tax can be calculated by multiplying your most recent home value assessment by the residential rate set by your local municipality. In the province of Ontario, these are based on the following:
- The value of your home, as assessed by the Municipal Property Assessment Corporation (MPAC). This assessment takes into account a combination of factors about your home such as its lot size, whether it has a basement, and if its condition has been improved with renovations and other structural updates. Whether or not it has any special features, such as a pool, is also taken into consideration, as well as the values of comparable properties in the neighbourhood.
- The latter is especially important for home buyers in rapidly appreciating neighbourhoods; surging local home prices over a short period of time can lead to a shock when the tax bill is opened the following year.
- The Education Tax Rate, implemented by the province of Ontario, the proceeds of which are used to fund regional schools.
- The Residential Tax Rate, which is determined annually by a municipality’s city council.
To learn more about how property taxes work in Ontario, check out our property tax FAQs for home buyers here.
Why Do Property Taxes Vary from City to City?
As a main purpose of property tax collection is to generate revenue for cities, individual city councils generally set it at a rate that will bring in sufficient cash to float their operating budgets. However, they have considerable flexibility on this; in Toronto, for instance, city council has purposely kept the residential tax rate below inflation as a promise to voters. Keeping property taxes low can also act as an incentive to draw more buyers to a city’s property market.
Real Estate Values Contribute to Property Tax Policy
Cities with high-valued local real estate and larger populations generally have more leeway on keeping their tax rate low, as the amount collected from individual homeowners is, as a reflection of the real estate prices in the area, generally higher, plus there are more tax payers to contribute to the pot. For example, as real estate prices and property assessment values increased in Toronto, the largest city in Ontario,, so do property tax revenues, giving council the ability to keep the rate low. Toronto had the lowest property tax rate out of 35 municipalities at 0.599704% in 2020.
Similarly, for Markham and Richmond Hill, the two municipalities that round out the regions where property tax rates are lowest at 0.628191% and 0.653108%, respectively, have comparably higher average home prices of $1,074,125 and $1,173,826 which allow for overall lower tax rates.
In contrast, the cities with the highest tax rates often have the lowest-priced real estate. In Windsor, for instance, where the property tax rate is the highest amongst the municipalities included in our report, the average home price was $428,276 in October. Similarly, in Thunder Bay, where the property tax rate is 1.562626%, the average home price was $226,628 in September 2020.
Another factor is the city’s commercial-to-residential tax ratio; in most municipalities, businesses pay at least double the amount of tax than homeowners, with the Canadian average at 2.5. Generally, a higher commercial property tax rate translates to a lower residential rate, and vice-versa; a local council may opt to hike the latter if they feel their community needs to offer more competitive advantages to businesses.
How Property Tax Rates Rank Across Ontario
Check out the infographic below to see which Ontario real estate markets have the lowest – and highest – property tax rates, and what homeowners could expect to pay based on sample assessments of $250,000, $500,000, and $1,000,000.
Property tax rates were sourced from each municipality’s website. October 2020 home prices were sourced from each region’s real estate board, and where these figures were not available, September 2020 home prices were used.
Compared to our 2019 property tax rate findings, municipality rankings stayed relatively similar. For example, all the municipalities in 2019 who had property tax rates of under 0.75% remained the same, although the order has fluctuated slightly for cities with the in the 3rd to 5th lowest ratesrankings, while Toronto remained the lowest at 0.614770%.
Cities With the Lowest Property Tax Rates in Ontario, 2020
- Toronto: 0.599704%
- Markham: 0.628191%
- Richmond Hill: 0.653108%
- Vaughan: 0.665259%
- Milton: 0.668702%
Cities With the Highest Property Tax Rates in Ontario, 2020
- Windsor: 1.775679%
- Thunder Bay: 1.562626%
- Sault Ste. Marie: 1.530970%
- North Bay: 1.528326%
- Sudbury: 1.492189%
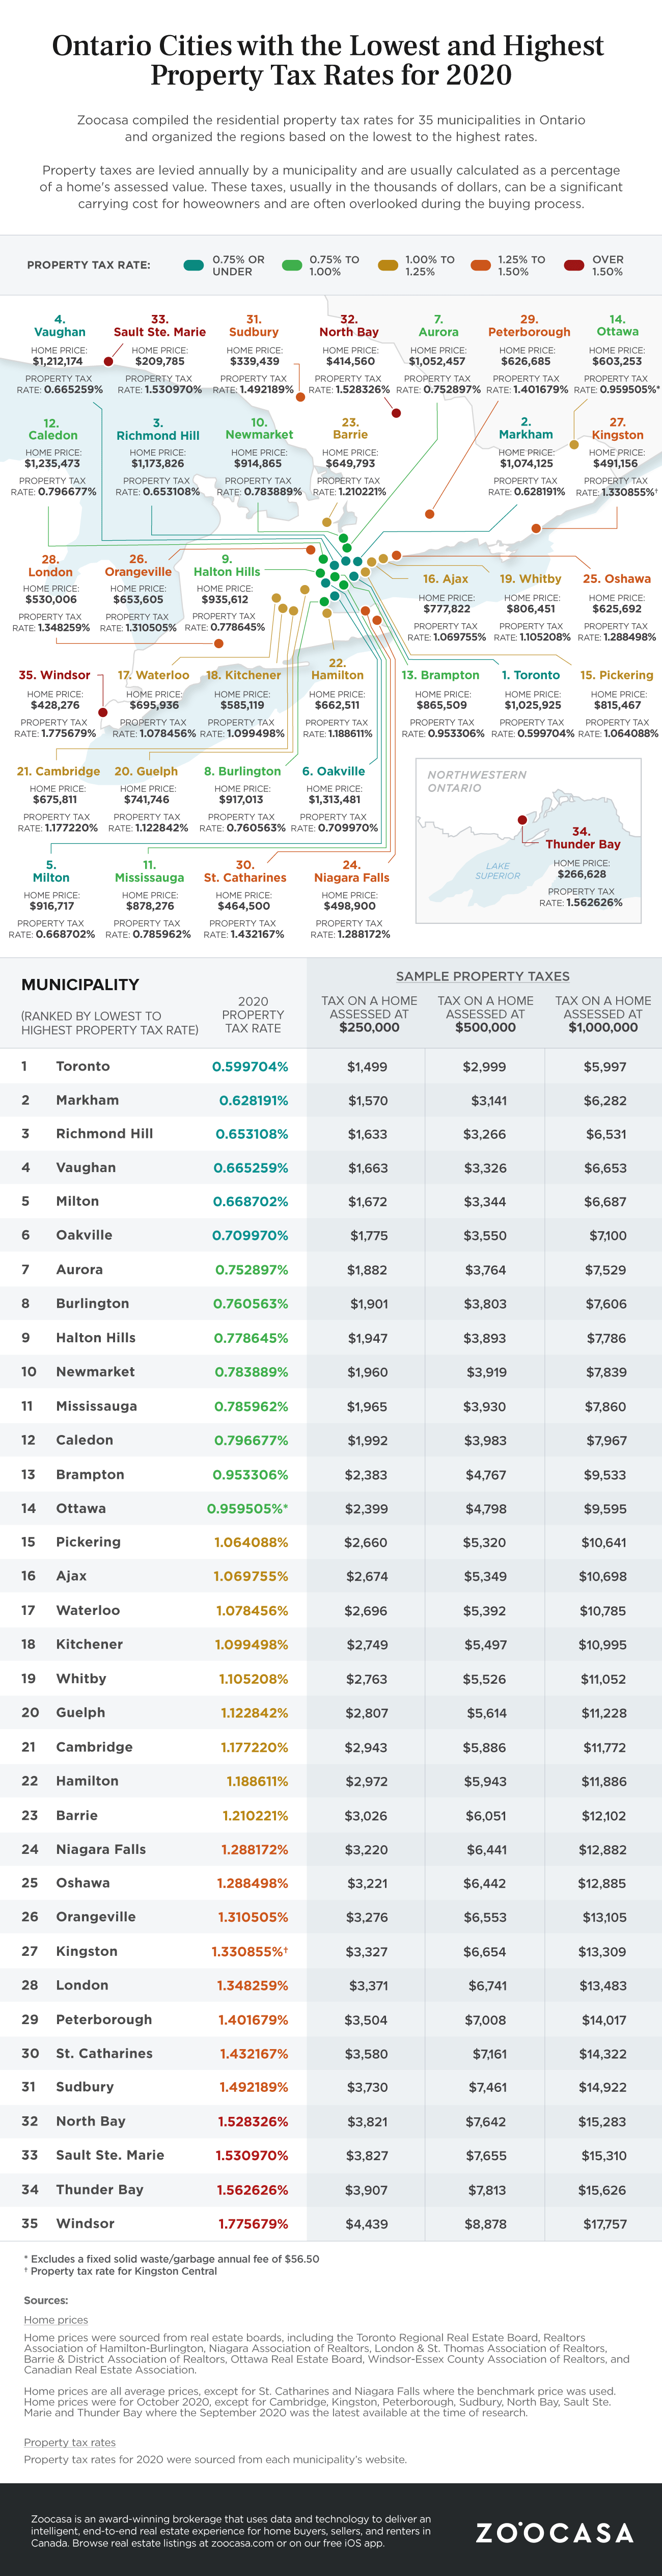
Table of Ontario Property Tax Rates for 2020
| Ranking by Rate (%) | Municipality | Property Tax Rate (%) | Property Tax on Home Assessed at $250,000 | Property Tax on Home Assessed at $500,000 | Property Tax on Home Assessed at $1,000,000 |
|---|---|---|---|---|---|
| 1 | Toronto | 0.599704% | $1,499 | $2,999 | $5,997 |
| 2 | Markham | 0.628191% | $1,570 | $3,141 | $6,282 |
| 3 | Richmond Hill | 0.653108% | $1,633 | $3,266 | $6,531 |
| 4 | Vaughan | 0.665259% | $1,663 | $3,326 | $6,653 |
| 5 | Milton | 0.668702% | $1,672 | $3,344 | $6,687 |
| 6 | Oakville | 0.70997% | $1,775 | $3,550 | $7,100 |
| 7 | Aurora | 0.752897% | $1,882 | $3,764 | $7,529 |
| 8 | Burlington | 0.760563% | $1,901 | $3,803 | $7,606 |
| 9 | Halton Hills | 0.778645% | $1,947 | $3,893 | $7,786 |
| 10 | Newmarket | 0.783889% | $1,960 | $3,919 | $7,839 |
| 11 | Mississauga | 0.785962% | $1,965 | $3,930 | $7,860 |
| 12 | Caledon | 0.796677% | $1,992 | $3,983 | $7,967 |
| 13 | Brampton | 0.953306% | $2,383 | $4,767 | $9,533 |
| 14 | Ottawa | 0.959505% | $2,399 | $4,798 | $9,595 |
| 15 | Pickering | 1.064088% | $2,660 | $5,320 | $10,641 |
| 16 | Ajax | 1.069755% | $2,674 | $5,349 | $10,698 |
| 17 | Waterloo | 1.078456% | $2,696 | $5,392 | $10,785 |
| 18 | Kitchener | 1.099498% | $2,749 | $5,497 | $10,995 |
| 19 | Whitby | 1.105208% | $2,763 | $5,526 | $11,052 |
| 20 | Guelph | 1.122842% | $2,807 | $5,614 | $11,228 |
| 21 | Cambridge | 1.17722% | $2,943 | $5,886 | $11,772 |
| 22 | Hamilton | 1.188611% | $2,972 | $5,943 | $11,886 |
| 23 | Barrie | 1.210221% | $3,026 | $6,051 | $12,102 |
| 24 | Niagara Falls | 1.288172% | $3,220 | $6,441 | $12,882 |
| 25 | Oshawa | 1.288498% | $3,221 | $6,442 | $12,885 |
| 26 | Orangeville | 1.310505% | $3,276 | $6,553 | $13,105 |
| 27 | Kingston | 1.330855% | $3,327 | $6,654 | $13,309 |
| 28 | London | 1.348259% | $3,371 | $6,741 | $13,483 |
| 29 | Peterborough | 1.401679% | $3,504 | $7,008 | $14,017 |
| 30 | St. Catharines | 1.432167% | $3,580 | $7,161 | $14,322 |
| 31 | Sudbury | 1.492189% | $3,730 | $7,461 | $14,922 |
| 32 | North Bay | 1.528326% | $3,821 | $7,642 | $15,283 |
| 33 | Sault Ste. Marie | 1.53097% | $3,827 | $7,655 | $15,310 |
| 34 | Thunder Bay | 1.562626% | $3,907 | $7,813 | $15,626 |
| 35 | Windsor | 1.775679% | $4,439 | $8,878 | $17,757 |
Sources
Home prices:
Home prices were sourced from real estate boards, including the Toronto Regional Real Estate Board, Realtors Association of Hamilton-Burlington, Niagara Association of Realtors, London & St. Thomas Association of Realtors, Barrie & District Association of Realtors, Ottawa Real Estate Board, Windsor-Essex County Association of Realtors, and Canadian Real Estate Association.
Home prices are all average prices, except for St. Catharines and Niagara Falls where the benchmark price was used.
Home prices were for October 2020, except for Cambridge, Kingston, Peterborough, Sudbury, North Bay, Sault Ste. Marie and Thunder Bay where the September 2020 was the latest available at the time of research.
Property tax rates:
Property tax rates for 2020 were sourced from each municipality’s website.
About Zoocasa
Zoocasa.com is a full-service brokerage that offers advanced online search tools to empower Canadians with the data and expertise they need to make more successful real estate decisions. View real estate listings on zoocasa.com or download our free iOS app.
For more information about this report or to set up a media interview, please email communications@zoocasa.com.