The Calgary housing market is coming off of a challenging year, as a combination of lower energy prices, softening job market, and new lending rules have taken a bite out of home buyers’ purchasing power.
Fewer prospective buyers in the market has led to oversupply in many parts of the city, reports the Calgary Real Estate Board, with an average of 5.2 months of inventory – the amount of time it would take to completely sell off all available Calgary real estate listings – leading to a decline in home prices across all home types.
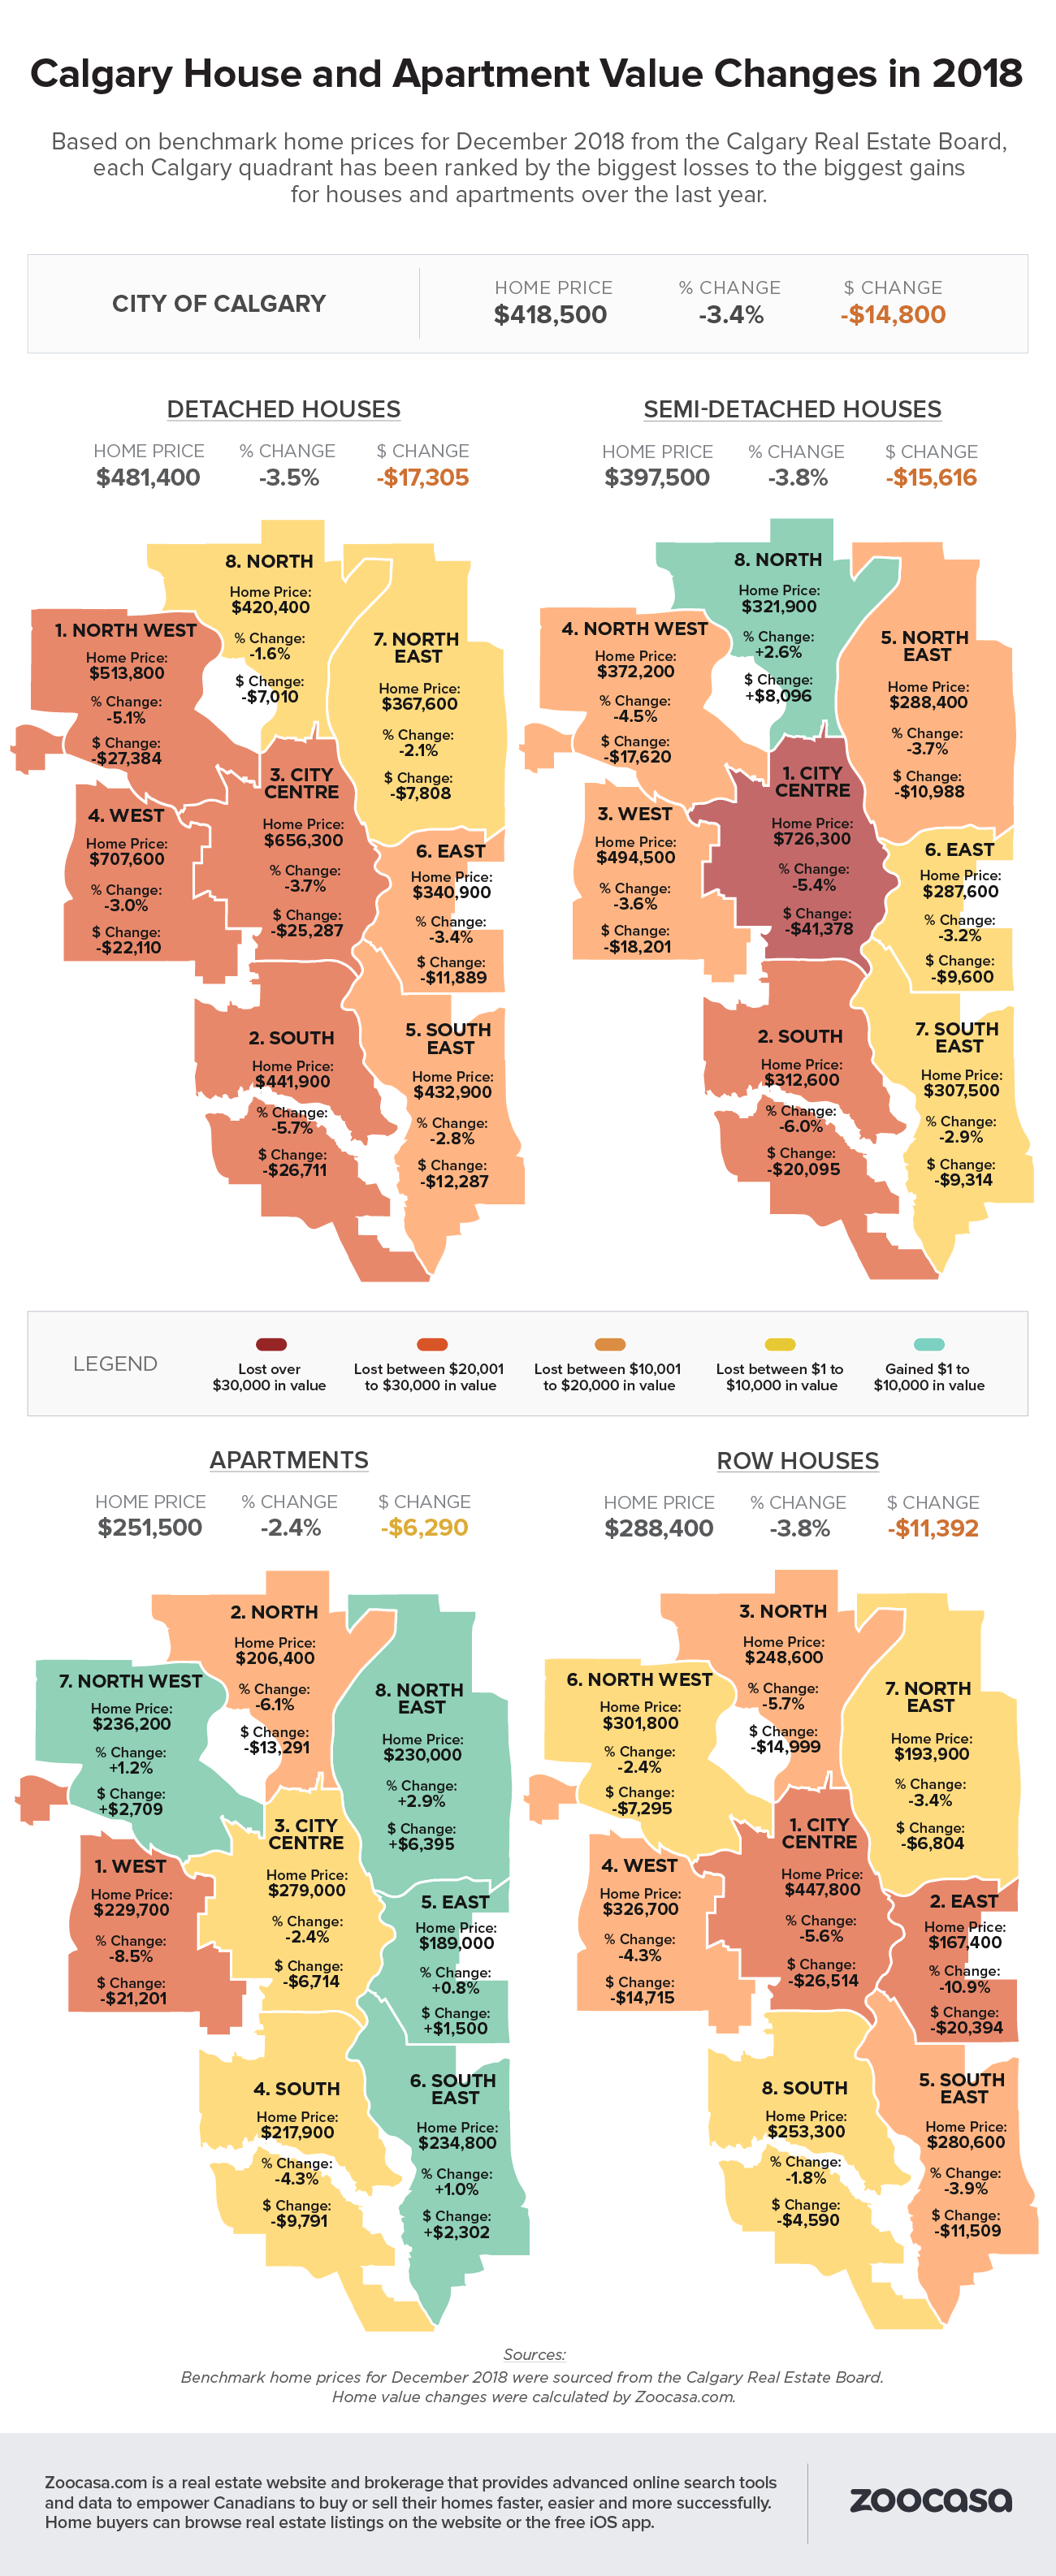
According to recent calculations made by Zoocasa, Calgary home prices have softened by -3.4% – representing a dollar amount loss of $14,800 – to an average of $418,500 over the course of 2018. While value declines ranged based on home type and quadrant, the majority fell between $10,001 to $20,000 over the last 12 months since December 2017.
Check out the infographic below to see how home prices changed for Calgary condos, detached houses, semi-detached houses, and row houses in 2018:
Only Condo Apartments Saw Growth
Calgary’s apartment segment was the least scathed throughout the year, posting the smallest year-over-year average decrease of -2.4% to $251,500, a difference of $6,290.
They were also the most likely home type to experience price increases in some neighbourhoods, with the biggest uptick seen in the North East by 2.9% – there, a condo owner would have seen an average appreciation of $6,395 from 2017, to an average of $230,000. Apartment prices were also up in the North West by 1.2% ($2,709) to $236,200, by 1% in the South East ($2,302.) to $234,800, and 0.8% in the East ($1,500) to $189,000.
Apartment prices fell the most in the West by -8.5% ($21,201) to $229,700, and in the North by -6.1% ($13,291) to $206,400.
Buying conditions for condos varied across the city; they saw the least amount of competition in the North West, with a sales-to-new-listings ratio of 20.8% and only five of 24 homes listed sold. However, the East is a tight sellers’ market due to extremely low levels of new inventory – three of four units listed for sale sold. Conditions were mainly balanced in City Centre, North and North East.
Steep Price Declines for Detached Houses
Homes at higher price points saw greater depreciation over 2018; the average detached home in Calgary fell -3.5% to an average of $481,400, representing a loss of $17,305, with a decrease between $20,001 and $30,000 in the majority of neighbourhoods.
Detached home values fell the most by percentage in the South, down -5.7% ($26,711) to $441,900, and the most by dollar amount in the North West by $27,384 (-5.1%) to an average of $513,800.
That’s followed by City Centre where they were down -3.7% ($25,287) to $656,300.
They declined the least in North by -1.6% ($7,010) to $420,400, and in North East by -2.1% ($7,808) to $367,600.
However, despite widespread price depreciation, detached markets remained largely in sellers’ territory throughout the city, with most or even more than all new listings sold. This was especially evident in the North West where the sales-to-new-listings ratio was 120% with 76 sales and 63 newly listed, and in East at 190%, with 19 sales and 10 homes listed. City Centre remained firmly in balanced territory with a ratio of 52%.
Semi-Detached and Row House Prices Also Down Across Calgary
The steepest year-over-year price decline by dollar amount actually occurred in the semi-detached segment in City Centre – there, values plunged -5.4% by a whopping $41,378. Losses were closer to the $10,001 – $20,000-range across the city, however, with the average semi-detached price down -3.8% to $397,500. The largest declines were also felt in the South, down -6% ($20,095) to $312,600, and the West by -3.6% ($18,201) to $494,500.
Prices actually rose in the North by 2.6% to an average of $321,900 (+$8.096), and the South East posted the smallest decline in average price of $9,314 (-2.9%) to $307,500.
Row house prices were also down -3.8% to an average of $288,400, representing an $11,392 drop. The largest decline by percentage was in City Centre, with the average price down -5.6% (-$26,514) to $447,800, and in the East, down -10.9% ($20,394) to $167,400.
The smallest declines were in South by -1.8% ($4,590) to $253,300, North East by -3.4% ($6,804) to $193,900.
Methodology
December 2018 benchmark home prices and year-over-year percentage changes for properties and quadrants were sourced from the Calgary Real Estate Board. Changes in dollar value were calculated by Zoocasa.
About Zoocasa
Zoocasa.com is a real estate website and brokerage that provides advanced online search tools and data to empower Canadians to buy or sell their homes faster, easier and more successfully. Home buyers can browse real estate listings on the website or the free real estate iOS app.
For more information about this report or to set up a media interview, please email communications@zoocasa.com.